Page History
...
- In any browser, go to camicroscope.org/
.Multiexcerpt include nopanel true MultiExcerptName ExitDisclaimer PageWithExcerpt wikicontent:Exit Disclaimer to Include
The caMicroscope Login page appears.

- Click
 .
.
The Google Offline Access page appears.

- Click Allow.
The caMicroscope page of product options appears.

- Scroll down to the DataScope - beta release section and click
 .
.
A demo of DataScope appears.
...
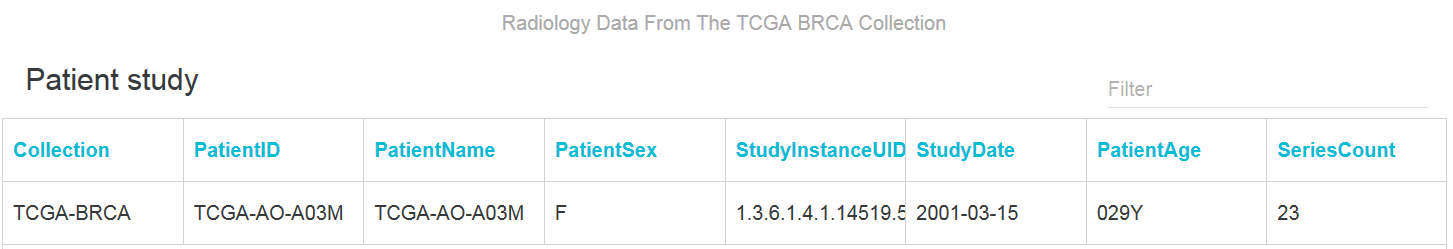
To select data in a data table, first click the DataTable tab, then click a row, which represents an image seriesa patient. The patient is linked so that radiology data from The Cancer Image Archive (TCIA) can be retrieved in subsequent screens.
A new browser window appears, showing patient information about all of the images in that seriesrelevant to the radiology data.
Using the SPLOM Tab
DataScope displays both various types of charts, including bubble charts and histograms, on the SPLOM (ScatterPLot Of Matrices) tab. Bubble charts are a type of scatterplot in which the data points are replaced with bubbles. An additional dimension of the data is represented in the size of the bubbles.
...