Page History
...
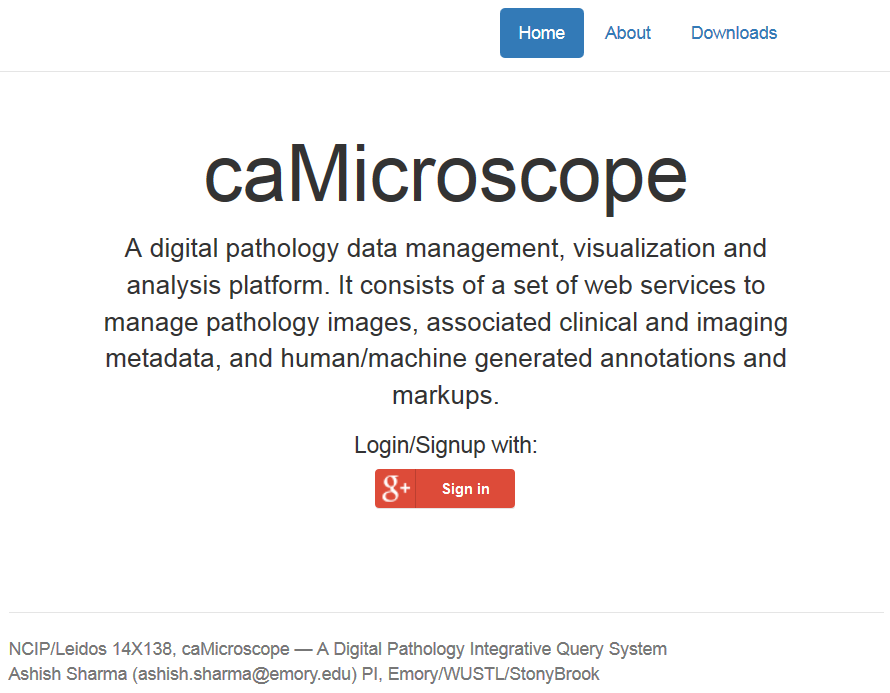
- In any browser, go to camicroscope.org
.Multiexcerpt include MultiExcerptName ExitDisclaimer nopanel true MultiExcerptName ExitDisclaimer PageWithExcerpt wikicontent:Exit Disclaimer to Include
The caMicroscope Login page appears.
- Click .
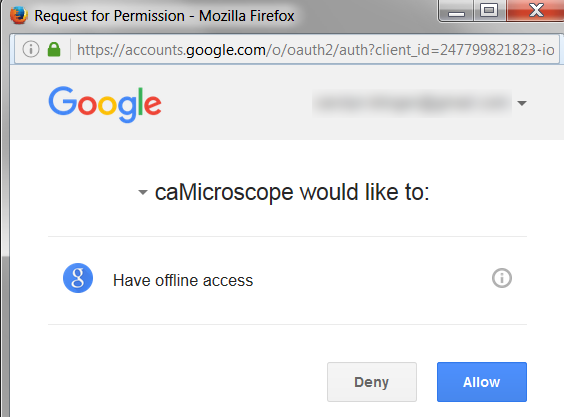
If you have not yet logged into Google, you are prompted the log in. Once you are logged in, the Google Offline Access page appears.
- Click Allow.
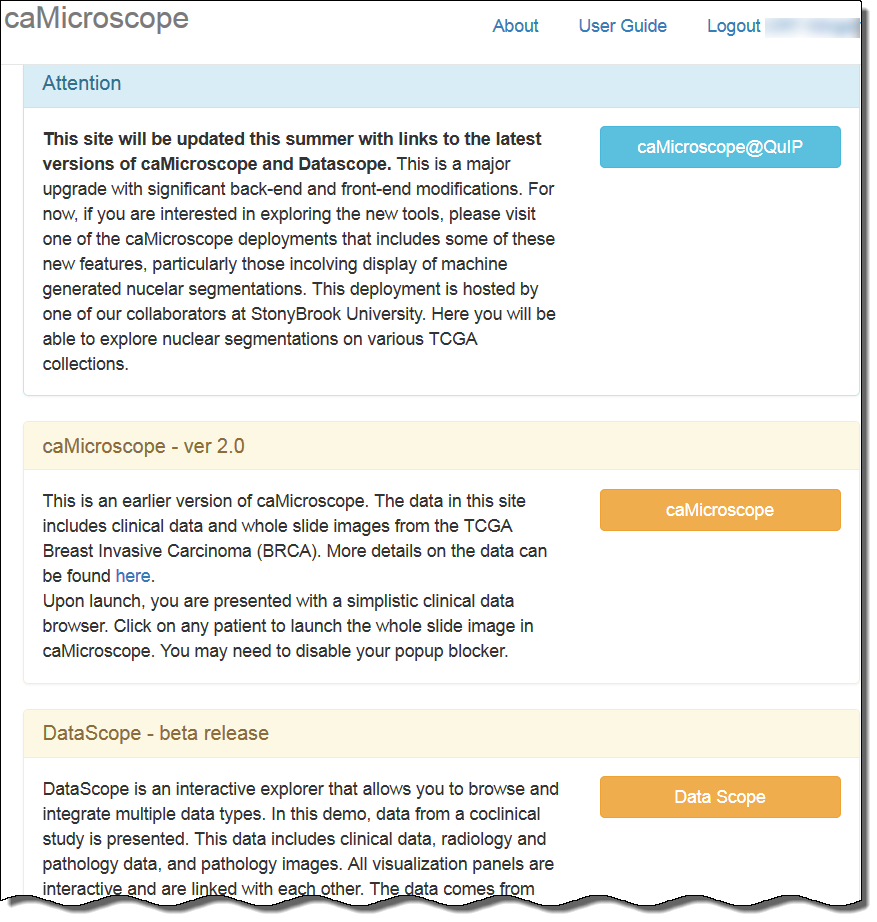
The caMicroscope page of product options appears.
- Scroll down to the DataScope - beta release section and click .
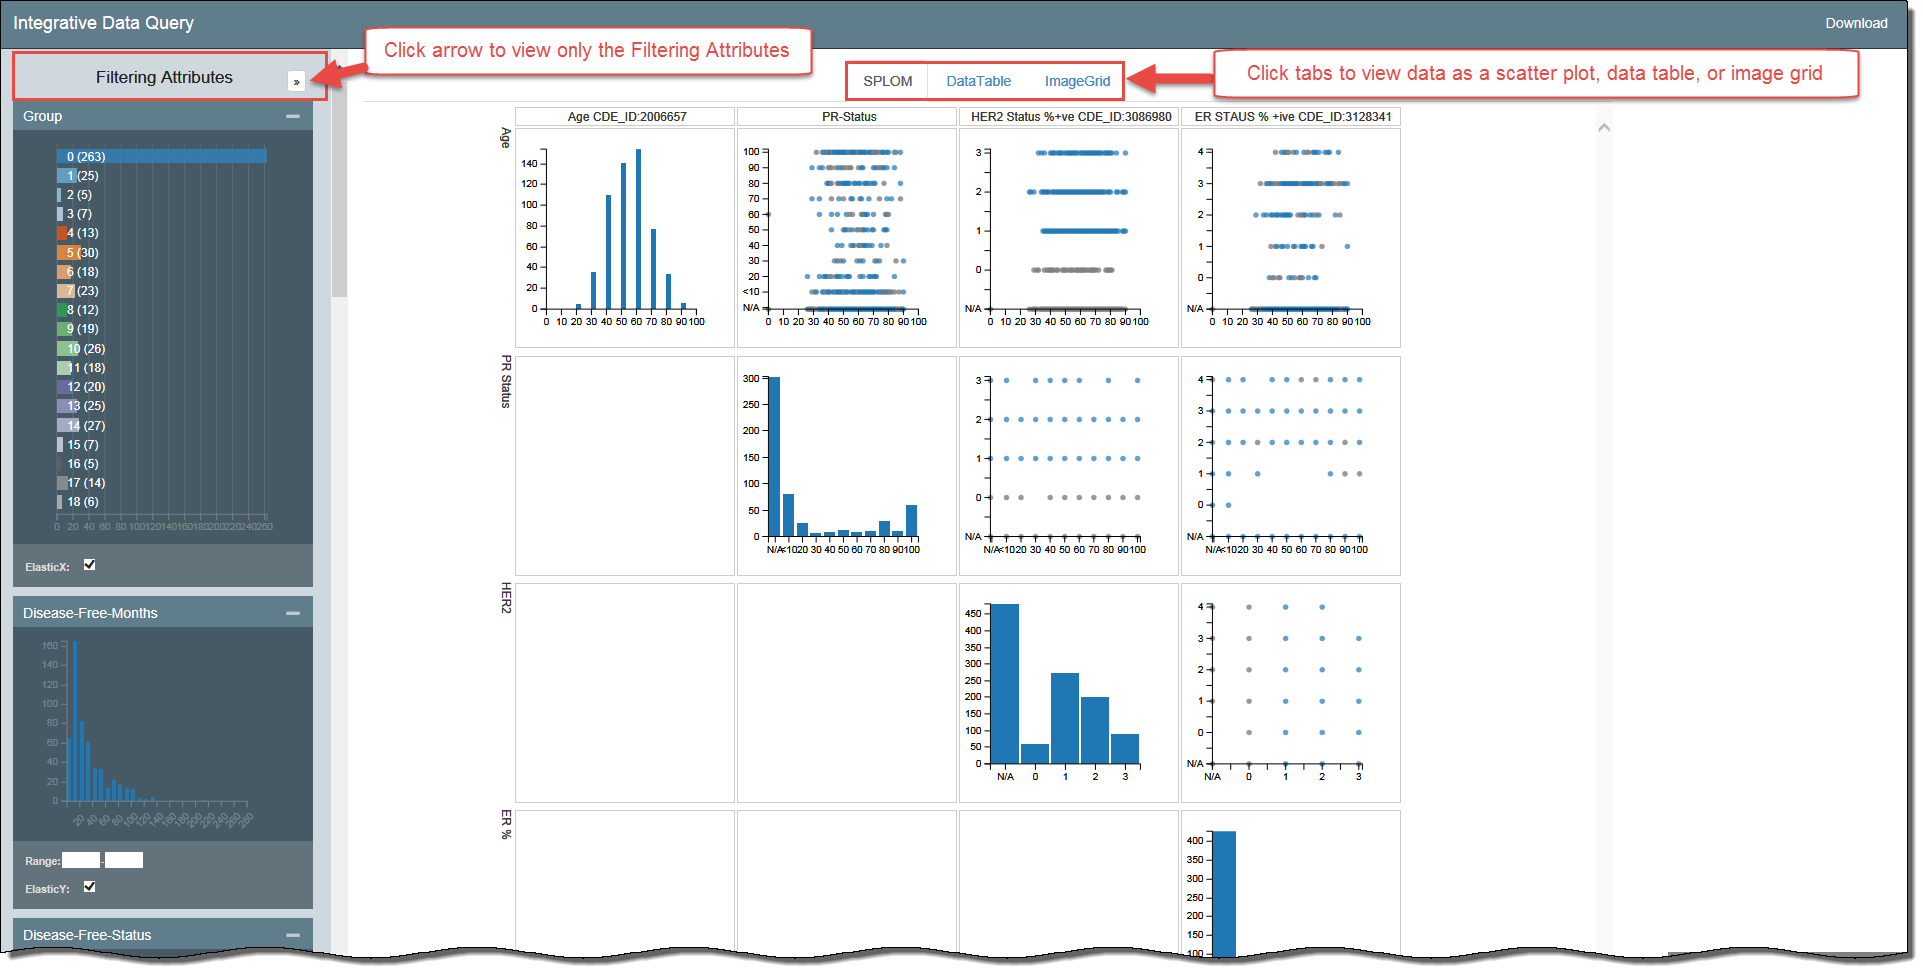
A demo of DataScope appears.
...
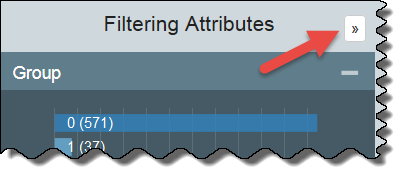
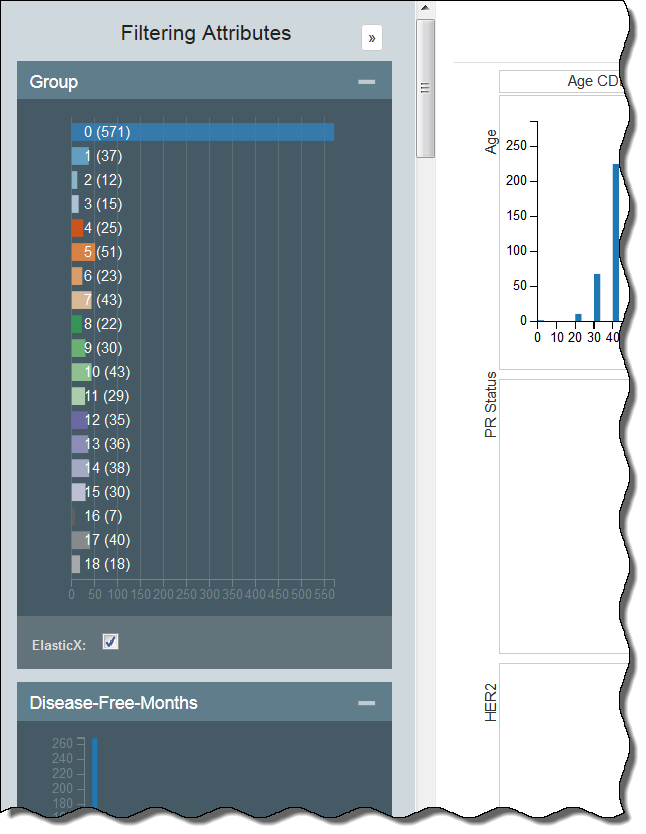
For a more convenient view of the filtering options, click the arrow at the top of the Filtering Attributes panel. This expands the view of the filtering attributes so that they fill the screen.
All of the filtering attributes appear, as well as a Download link, for downloading a spreadsheet of the data after you have (or have not) filtered it.
...
In the following example, the Group and Disease-Free Months panels are open.
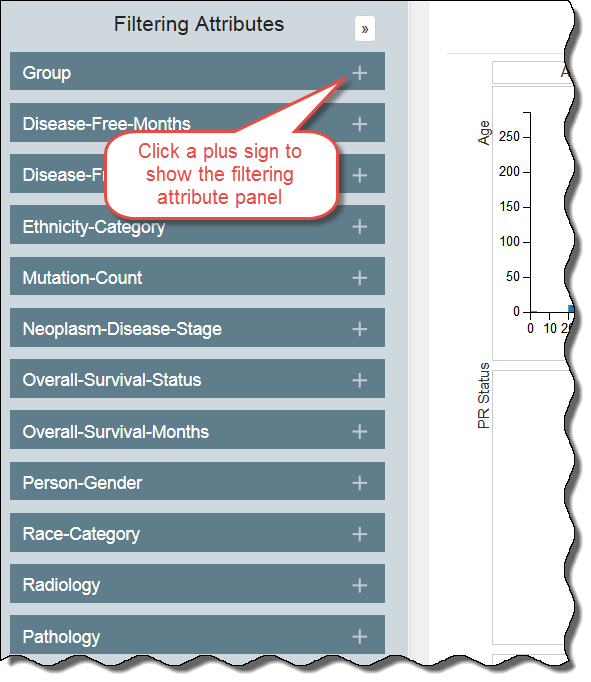
In the following example, all of the filtering attribute panels are hidden.
Clearing Filters
You must clear each filter individually by clicking in each panel. As you clear a filter, the number of records that meet your filtering criteria will likely increase. You may want to note a control value, such as the number of records in the group, to illustrate the change in selected records as you apply filters.
...
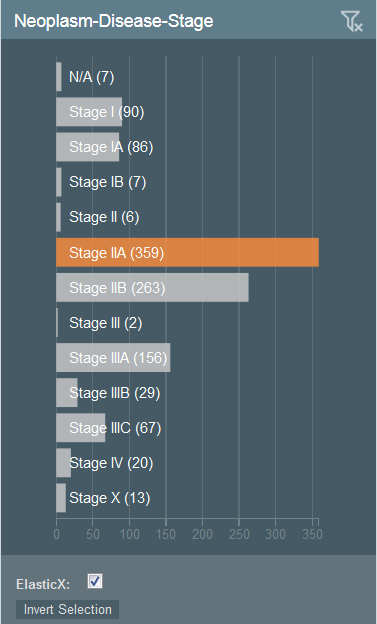
In the following graph, Stage IIA has been selected, making the other bars unavailable for selection.
Pie Charts
To filter using a pie chart, click one or more pieces of the pie.
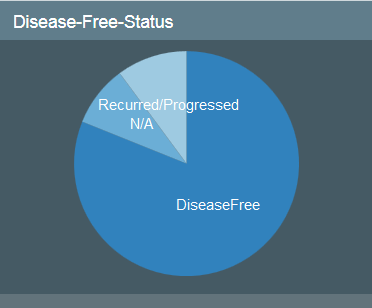
In the following chart, none of the categories have been selected.
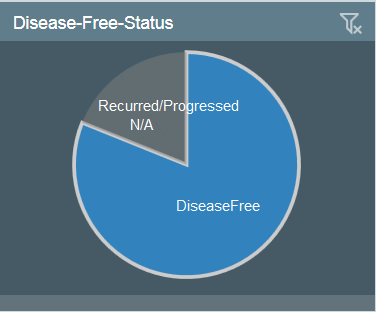
In the following chart, the DiseaseFree category has been selected and the other categories are not available.
Histograms
To filter attributes using a histogram, you have two options that accomplish the same thing:
...
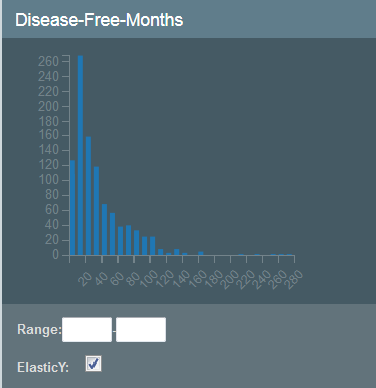
In the following histogram, no values have been selected yet.
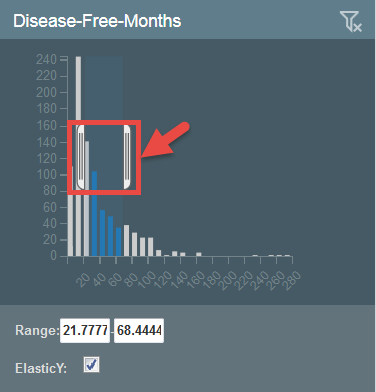
In the following histogram, a range has been selected, which exists between the brackets and appears in the range boxes below the chart. The values are entered automatically as you move the brackets.
Understanding the Visualization Types
...
In the following example, a user has selected the filtering category of Asian and then further filtered the results to show those Asians between the ages of 30 and 40. Blue data points are selected, while grey are unavailable for selection.
Using a Data Table
A data table provides a tabular representation of the data. Data tables show 100 records at a time and you can page through them. The following is an example of a data table.
To select data in a data table, first click the DataTable tab, then click a row, which represents a patient. The patient is linked so that radiology data from The Cancer Image Archive (TCIA) can be retrieved in subsequent screens.
A new browser window appears, showing patient information relevant to the radiology data.
Using the SPLOM Tab
DataScope displays both various types of charts, including bubble charts and histograms, on the SPLOM (ScatterPLot Of Matrices) tab. Bubble charts are a type of scatterplot in which the data points are replaced with bubbles. An additional dimension of the data is represented in the size of the bubbles.
You can filter data on the SPLOM tab by adjusting the brackets in a histogram, as explained above, or by defining a selection area in a bubble chart. Only blue bars or dots within the selection area are available for selection. The background of the area you have selected is shaded blue.
Using an Image Grid
An Image Grid is a two-column list of images. When more screen real estate becomes available, the list of images expands to add more columns.
To select an image grid, click the ImageGrid tab. All of the images matching the filters you selected appear. Click an image to open it in caMicroscope. Each time you click the image, it zooms in further. Learn more about using caMicroscope in the caMicroscope User's Guide
| Multiexcerpt include | ||||||||
|---|---|---|---|---|---|---|---|---|
|
...

