 |
Page History
- Add data values to Data and Conditions.
- To import a file of data values
- Save the spreadsheet of data values to a csv (comma-separated value) file.
- Click Import csv and select and follow the prompts to add the data file to the Findings Info.
- The columns and data are added to Data and Conditions.
- To add the data values manually
- Specify the number of columns and rows for the matrix, and click Update.
- Add the data values to the rows.
- Specify the number of columns and rows for the matrix, and click Update.
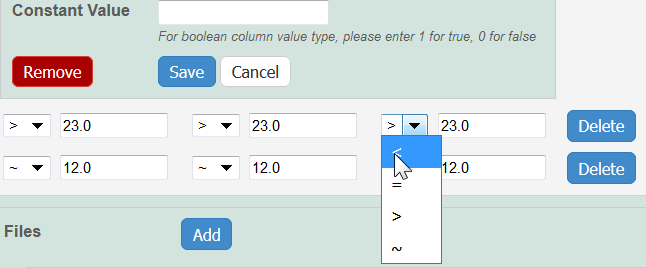
Info Whether you imported or added information manually, you can preface each data value with one of the following: Maintain the default, equal to (=), or select greater than (>), less than (<), or infinity (approximate).
- To import a file of data values
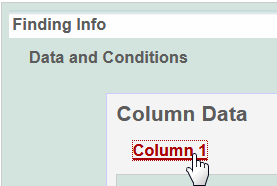
- To define the column, click an underlined column heading.
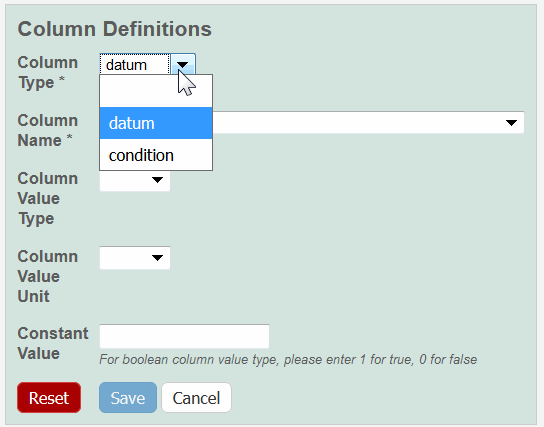
The Column Definition panel displays.
Select a Column Type, Datum or Condition.
Info title Options may vary in the following fields Based on the Column Type selection and the type of characterization, the options in the following fields may vary. Options previously-added as other may also be listed.
Select a Column Name or select other and add a new one.
Info title Column Notes You can add up to three cell viability Column Names, including cell viability, cell viability B, and cell viability C. You can further identify the column with the Column Value Type. For Column Type, Datum, the following characterization(s) displays customized display customized Column Name(s).
Characterization Type Column Type and Column Name Option(s) Physico-Chemical - Molecular – Molecular Weight
- Purity – % purity for sample
- Relaxivity – R1, R2, T1, T2
- Size – PD1, Peak N , RMS size, Z Average
- Surface – charge, zeta potential
In Vitro Enzyme Induction – % of Control
In Vivo Click Other to name the column yourself.


