Page History
| Multiexcerpt | ||||||||||||||||||||||||||||||
|---|---|---|---|---|---|---|---|---|---|---|---|---|---|---|---|---|---|---|---|---|---|---|---|---|---|---|---|---|---|---|
| ||||||||||||||||||||||||||||||
The next several sections analyze available statistics for direct use of EVS resources on EVS servers. This section covers direct use of NCI-hosted EVS terminology browsers and the LexEVS local java API that supports them. Later sections cover the LexEVS distributed (remote), LexEVS caGrid services, the term suggestion site, and ftp download services.
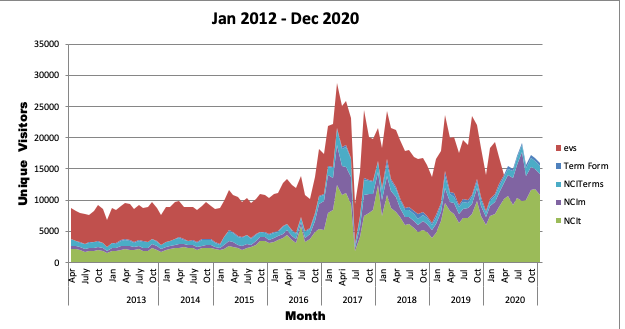
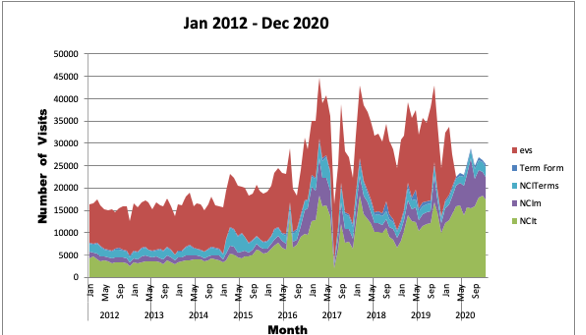
The EVS browsers and LexEVS APIs at NCI are covered by the AWStats and Wusage applications, recording various statistics including number of unique visitors, visits, number of pages viewed and data volume accessed. These have been collected below to give a window into the use of the EVS services. Appendix 1 lists the usage tracking pages from which these statistics are gathered. We are now able to identify and exclude most web crawler and similar automated hits, as well as internal use for testing and development purposes. Detailed examination of addresses and patterns of use suggest that the use reported below overwhelmingly represents real users from NCI and other organizations of interest. Analyzed below are figures for unique visitors and number of visits, as well as the volume of data communicated, which for all but ftp sites reflects high volumes of traffic in mostly compact units of terminology concept data. Statistical OverviewThe EVS browsers run off the LexEVS local API, and provide the highest number of direct users of EVS terminology servers. The lowest, but most informative, numbers are for unique visitors and number of visits. The number of unique visitors to the EVS family of browsers has averaged around 4,000 per month in 2015, growing to around 10,000 per month by the end of 2016 generating some 17,000 visits. Unique visitors to EVS browsers, per month
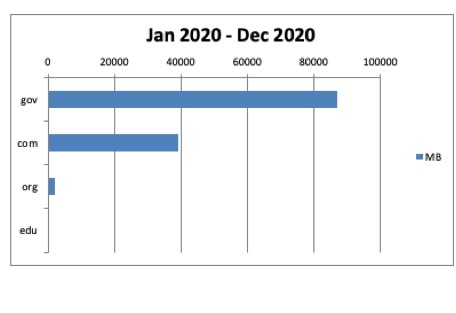
Number of visits to EVS browsers, per month Browser UsersThe data below is from January - December 20172020. It shows an overall view of which internet domains hit EVS browsers most heavily, and then breaks down each domain by top users. All browsers are put together for this analysis. Overall UseThe amount of bandwidth used was divided into four (4) major groups: Government .gov users, private .com and .net users, Educational .edu institutions, and Organizations .org. The data was analyzed and bots were discarded to avoid skewing the data. Data accessed (MB) from EVS browsers by domain
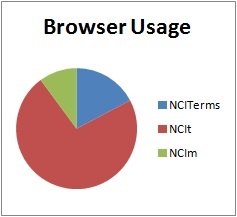
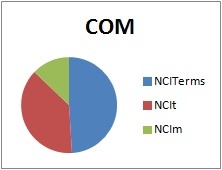
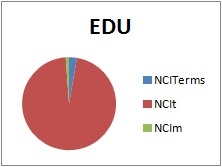
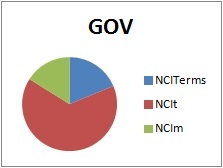
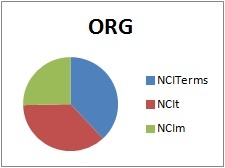
Data accessed (MB) from EVS browsers by domain Usage Patterns of the Three EVS BrowsersThe three browsers offered by EVS are
Nearly 75% of all use goes to the NCIt browser, including almost all use from the educational domain and two thirds of government use. By contrast, half of commercial domain use goes to NCI Terms, while .org use is almost evenly split between all three browsers.
|