Page History
| Wiki Markup |
|---|
{scrollbar:icons=false} |
| Page info | ||||
|---|---|---|---|---|
|
| Wiki Markup |
|---|
{multi-excerpt:name=UseofBrowsers}The next several sections analyze available statistics for direct use of EVS resources on EVS servers. This section covers direct use of NCI-hosted EVS terminology browsers and the LexEVS local java API that supports them. Later sections cover the LexEVS distributed (remote), LexEVS caGrid services, the term suggestion site, and ftp download services.
{toc:minLevel=2}
The EVS browsers and LexEVS APIs at NCI are covered by the AWStats and Wusage applications, recording various statistics including number of unique visitors, visits, number of pages viewed and data volume accessed. These have been collected below to give a window into the use of the EVS services. Appendix 1 lists the usage tracking pages from which these statistics are gathered.
We are now able to identify and exclude most web crawler and similar automated hits, as well as internal use for testing and development purposes. Detailed examination of addresses and patterns of use suggest that the use reported below overwhelmingly represents real users from NCI and other organizations of interest. Analyzed below are figures for unique visitors and number of visits, as well as the volume of data communicated, which for all but ftp sites reflects high volumes of traffic in mostly compact units of terminology concept data.
h2. Statistical Overview
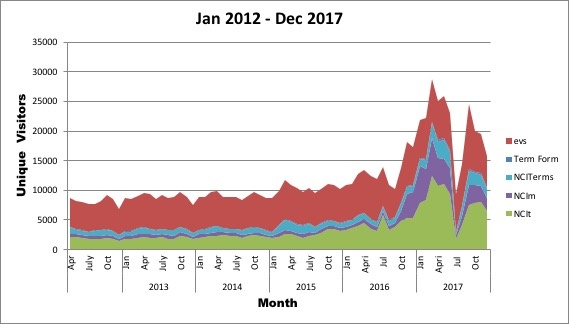
The EVS browsers run off the LexEVS local API, and provide the highest number of direct users of EVS terminology servers. The lowest, but most informative, numbers are for unique visitors and number of visits. The number of unique visitors to the EVS family of browsers has averaged around 3,000 per month over the past year, generating a total of around 6,000 visits per month.
{color:#002060}{*}Unique visitors to EVS browsers, per month{*}{color}
!BrowserVisitors.JPG|border=1,alt="Chart showing unique visitors to EVS browsers per month"!
{quote}
*Key*
|| Abbreviation || Site ||
| NCITerms | NCI Term Browser (many terminologies, value sets and mappings) |
| NCIt | NCI Thesaurus Browser (now one face of NCITerms, counted separately) |
| NCIm | NCI Metathesaurus Browser (separate app, searchable from NCITerms) |
| TermForm | EVS Term Suggestion site (covered later) |
{quote}
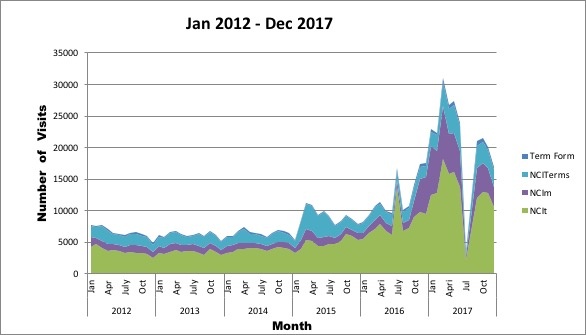
{color:#002060}{*}Number of visits to EVS browsers, per month{*}{color}
!BrowserVisits.JPG|border=1,alt="Chart showing number of visits to EVS browsers per month"!
h2. Browser Users
The data below is from January 2013 through July 2013. It shows an overall view of which domains hit EVS browsers most heavily, and then breaks down each domain by top users. All browsers are put together for this analysis.
h3. Overall Use
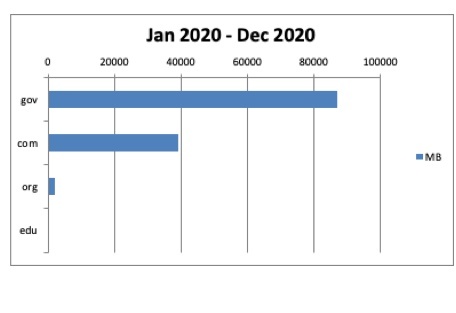
The amount of bandwidth used was divided into four (4) major groups: Government .gov users, private .com and .net users, Educational .edu institutions, and Organizations .org. The data was analyzed and bots were discarded to avoid skewing the data.
{color:#002060}{*}Data accessed (MB) from EVS browsers by domain{*}{color}
|| Domain || MB ||
| gov | {align:right}23164{align} |
| edu | {align:right}3586{align} |
| com/ net | {align:right}2205{align} |
| org | {align:right}1215{align} |
\\ {color:#002060}{*}Data accessed (MB) from EVS browsers by domain{*}{color}
!BrowserMBbyDomain.JPG|border=1,alt="Chart showing data accessed (MB) from EVS browsers by domain"!
h3. Users from .gov domain
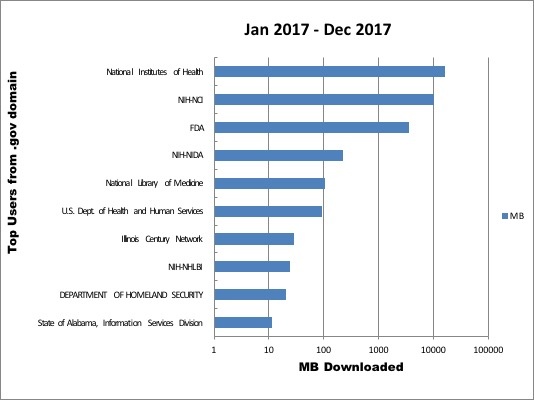
The numbers below show the top government users of the EVS browsers, as measured by the MB of data that were accessed. Agency names have been provided where they are known. The main users are internal to NCI and NIH, which is not surprising, but we have significant usage from FDA.
{color:#002060}{*}Top .gov EVS browser users: Data accessed (MB)*{color}
|| Organization || MB \\ ||
|NIH-NCI | {align:right}20366{align} |
|NIH | {align:right}1375{align} |
|FDA | {align:right}1115{align} |
|NIH-NLM | {align:right}137{align} |
|City of Philadelphia | {align:right}44{align} |
|NIH-NIMH | {align:right}32{align} |
|NIH-NIHCD | {align:right}28{align} |
|NIH-NHLBI | {align:right}26{align} |
|Los Angeles County | {align:right}22{align} |
|NIH-NIDA | {align:right}20{align} |
{color:#002060}{*}Top .gov EVS browser users: Data accessed (MB)*{color}
!GovBrowserUsers.JPG|border=1,alt="Chart showing top 10 non-CBIIT .gov EVS browser users: data accessed"!
h3. Users from .com domain
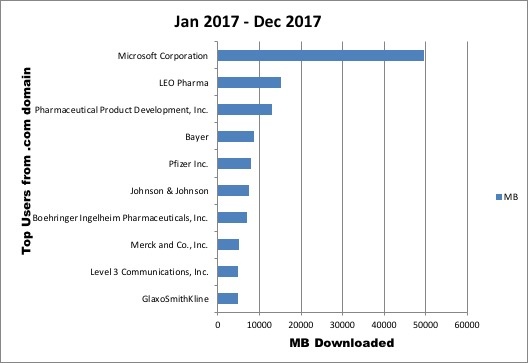
We combined the .net and .com users into one group as both contained a number of private corporations and individual users from a wide variety of ISPs (collectively labeled as ISP). Business names have been provided where known. The graph below does not fully show ISPs they dwarf the next largest groups.
{color:#002060}{*}Top .com EVS browser users: Data accessed (MB)*{color}
|| Business || MB ||
|Lockheed Martin | {align:right}479{align} |
|Viasat Communications Inc. | {align:right}429{align} |
|Roche | {align:right}284{align} |
|Deloitte & Touche | {align:right}239{align} |
|PSINet, Inc. | {align:right}185{align} |
|Ingenuity Systems | {align:right}157{align} |
|GlaxoSmithKline | {align:right}115{align} |
|Johnson & Johnson | {align:right}111{align} |
|Qwest Communications Company, LLC | {align:right}109{align} |
|XO Communications | {align:right}96{align} |
{color:#002060}{*}Top .com EVS browser users: Data accessed (MB)*{color}
!ComBrowserUsers.JPG|border=1,alt="Chart showing top .com EVS browser users: Data accessed"!
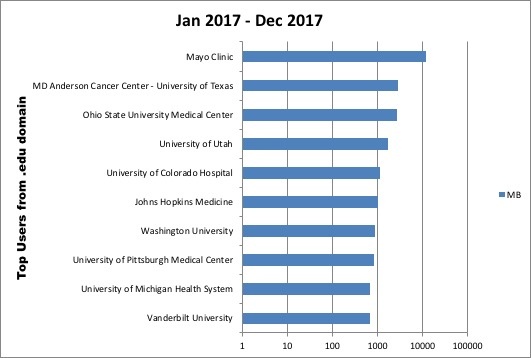
h3. Users from .edu domain
The edu users were widely distributed across many American universities and a small selection of foreign institutions.
{color:#002060}{*}Top .edu EVS browser users: Data accessed (MB)*{color}
|| Institution || MB ||
|University of Muenster | {align:right}1159{align} |
|Mayo Clinic | {align:right}975{align} |
|University of Geneva | {align:right}513{align} |
|University of Pittsburgh Medical Center | {align:right}263{align} |
|Washington University in St. Louis | {align:right}181{align} |
|Vanderbilt University | {align:right}158{align} |
|Harvard University | {align:right}119{align} |
|Technical University of Madrid | {align:right}95{align} |
|University of Michigan Health System | {align:right}62{align} |
|University Bordeaux Segalen | {align:right}61{align} |
{color:#002060}{*}Top .edu EVS browser users: Data accessed (MB) \[Mayo truncated\]*{color}
!EduBrowserUsers.JPG|border=1,alt="Chart showing top 10 .edu EVS browser users: Data accessed (MB) Mayo truncated"!
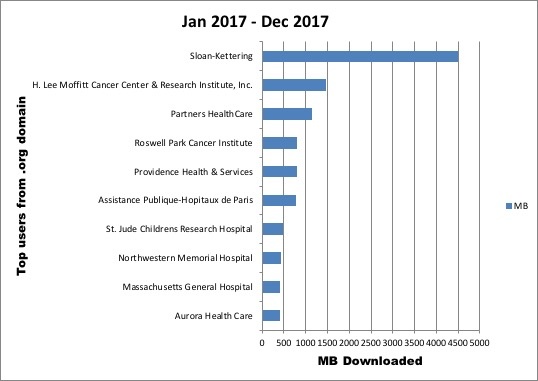
h3. Users from .org domain
Like the .edu users, the .org users were widely distributed across a variety of organizations.
{color:#002060}{*}Top .org EVS browser users: Data accessed (MB)*{color}
|| Organization || MB ||
|The National Marrow Donor Program | {align:right}246{align} |
|Fred Hutchinson Cancer Research Center | {align:right}190{align} |
|Massachusetts General Hospital | {align:right}175{align} |
|Marshfield Clinic | {align:right}165{align} |
|Cancer Care Ontario | {align:right}111{align} |
|Partners HealthCare | {align:right}94{align} |
|Montefiore Medical Center | {align:right}61{align} |
|BayCare Health System - Tampa | {align:right}60{align} |
|American College of Cardiology | {align:right}56{align} |
|Chemical Institute of Toxicology | {align:right}56{align} |
{color:#002060}{*}Top .org EVS browser users: Data accessed (MB)*{color}
!OrgBrowserUsers.JPG|border=1,alt="Chart showing top 10 .org EVS browser users: data accessed"!
{multi-excerpt} |
| Multiexcerpt | ||||||||||||||||||||||||||||||||||||||||||||||||||||||||||||||||||||||||||||||||||||||||||||||||||||||||||||||||
|---|---|---|---|---|---|---|---|---|---|---|---|---|---|---|---|---|---|---|---|---|---|---|---|---|---|---|---|---|---|---|---|---|---|---|---|---|---|---|---|---|---|---|---|---|---|---|---|---|---|---|---|---|---|---|---|---|---|---|---|---|---|---|---|---|---|---|---|---|---|---|---|---|---|---|---|---|---|---|---|---|---|---|---|---|---|---|---|---|---|---|---|---|---|---|---|---|---|---|---|---|---|---|---|---|---|---|---|---|---|---|---|---|
| ||||||||||||||||||||||||||||||||||||||||||||||||||||||||||||||||||||||||||||||||||||||||||||||||||||||||||||||||
| Multiexcerpt | ||||||||||||||||||||||||||||||||||||||||||||||||||||||||||||||||||||||||||||||||||||||||||||||||||||||||||||||||
| ||||||||||||||||||||||||||||||||||||||||||||||||||||||||||||||||||||||||||||||||||||||||||||||||||||||||||||||||
The next several sections analyze available statistics for direct use of EVS resources on EVS servers. This section covers direct use of NCI-hosted EVS terminology browsers and the LexEVS local java API that supports them. Later sections cover the LexEVS distributed (remote), LexEVS caGrid services, the term suggestion site, and ftp download services.
The EVS browsers and LexEVS APIs at NCI are covered by the AWStats and Wusage applications, recording various statistics including number of unique visitors, visits, number of pages viewed and data volume accessed. These have been collected below to give a window into the use of the EVS services. Appendix 1 lists the usage tracking pages from which these statistics are gathered. We are now able to identify and exclude most web crawler and similar automated hits, as well as internal use for testing and development purposes. Detailed examination of addresses and patterns of use suggest that the use reported below overwhelmingly represents real users from NCI and other organizations of interest. Analyzed below are figures for unique visitors and number of visits, as well as the volume of data communicated, which for all but ftp sites reflects high volumes of traffic in mostly compact units of terminology concept data. Statistical OverviewThe EVS browsers run off the LexEVS local API, and provide the highest number of direct users of EVS terminology servers. The lowest, but most informative, numbers are for unique visitors and number of visits. The number of unique visitors to the EVS family of browsers has averaged around 3,000 per month over the past year, generating a total of around 6,000 visits per month. Unique visitors to EVS browsers, per month
Number of visits to EVS browsers, per month Browser UsersThe data below is from January 2013 through July 2013. It shows an overall view of which domains hit EVS browsers most heavily, and then breaks down each domain by top users. All browsers are put together for this analysis. Overall UseThe amount of bandwidth used was divided into four (4) major groups: Government .gov users, private .com and .net users, Educational .edu institutions, and Organizations .org. The data was analyzed and bots were discarded to avoid skewing the data. Data accessed (MB) from EVS browsers by domain
Data accessed (MB) from EVS browsers by domain Users from .gov domainThe numbers below show the top government users of the EVS browsers, as measured by the MB of data that were accessed. Agency names have been provided where they are known. The main users are internal to NCI and NIH, which is not surprising, but we have significant usage from FDA. Top .gov EVS browser users: Data accessed (MB)
Top .gov EVS browser users: Data accessed (MB) Users from .com domainWe combined the .net and .com users into one group as both contained a number of private corporations and individual users from a wide variety of ISPs (collectively labeled as ISP). Business names have been provided where known. The graph below does not fully show ISPs they dwarf the next largest groups. Top .com EVS browser users: Data accessed (MB)
Top .com EVS browser users: Data accessed (MB) Users from .edu domainThe edu users were widely distributed across many American universities and a small selection of foreign institutions. Top .edu EVS browser users: Data accessed (MB)
Top .edu EVS browser users: Data accessed (MB) [Mayo truncated] Users from .org domainLike the .edu users, the .org users were widely distributed across a variety of organizations. Top .org EVS browser users: Data accessed (MB)
Top .org EVS browser users: Data accessed (MB) | ||||||||||||||||||||||||||||||||||||||||||||||||||||||||||||||||||||||||||||||||||||||||||||||||||||||||||||||||
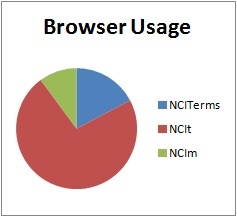
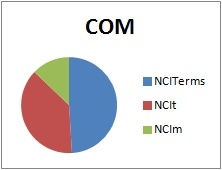
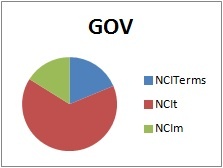
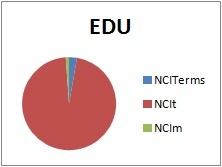
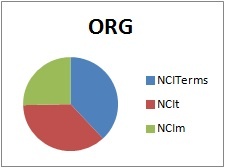
Usage Patterns of the Three EVS BrowsersThe three browsers offered by EVS are:
Nearly 75% of all use goes to the NCIt browser, including almost all use from the educational domain and two thirds of government use. By contrast, half of commercial domain use goes to NCI Terms, while .org use is almost evenly split between all three browsers.
|


| Wiki Markup |
|---|
{scrollbar:icons=false} |