Page History
...
Using the procedures explained in the DataScope Developer's Guide, you can customize your data, dashboards, and visualizations. This guide explains the way to manipulate the scatterplots, data tables, and image grids you use to visualize your data. This documentation does not yet include an explanation of how to use information about the heatmap visualization type.
...
- In any browser, go to camicroscope.org/
.Multiexcerpt include nopanel true MultiExcerptName ExitDisclaimer PageWithExcerpt wikicontent:Exit Disclaimer to Include
The caMicroscope Login page appears.
- Click
 .
.
The Google Offline Access page appears.
- Click Allow.
The caMicroscope page of product options appears.
- Scroll down to the DataScope - beta release section and click
 .
.
A demo of DataScope appears, which includes data from a co-clinical study. This data includes clinical, radiology, and pathology data, and pathology images from UC Davis and the TCGA BRCA studiesstudy.
Filtering the Data
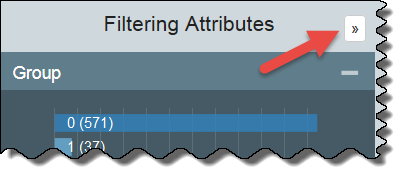
DataScope includes many filters for adjusting your view of the data. The filters that appear are those that an administrator has customized for your use with DataScope and are not necessarily represented in the screenshots in this guide.
At the top of the Filtering Attributes panel, click the arrow to expand the view of the filtering attributes so that they fill the screen.

Understanding the Visualization Types
...