Page History
...
- Bar Graphs: Click one or more bars. Selecting a bar may influence the availability of other bars.
In the following graph, none of the stages have been selected and each bar is represented by a different color.
In the following graph, Stage IIA has been selected, making the other bars unavailable for selection.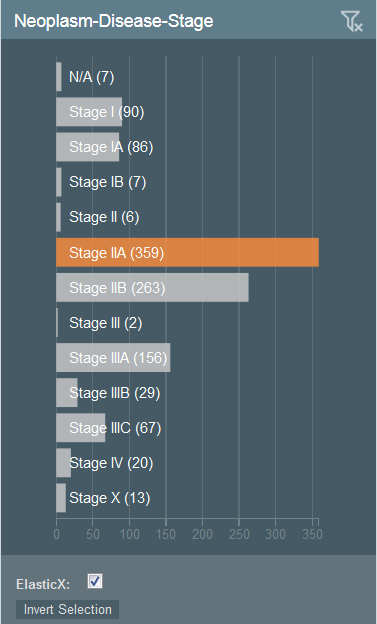
- Pie Chart: Click a piece of the pie.
In the following chart, none of the categories have been selected.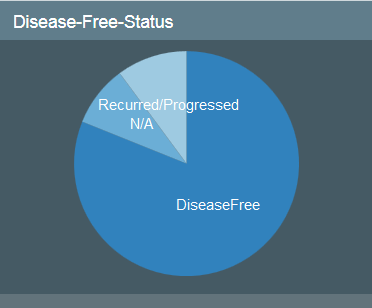
In the following chart, the DiseaseFree category has been selected.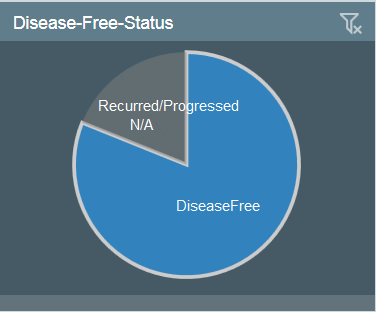
Understanding the Visualization Types
...