Page History
...
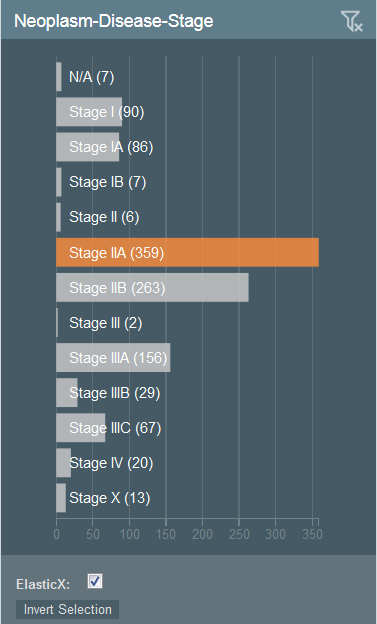
In the following graph, Stage IIA has been selected, making the other bars unavailable for selection.
To clear the filter, click  .
.
Pie Charts
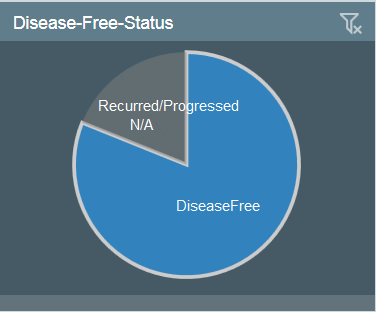
To filter using a pie chart, click one or more pieces of the pie.
...
In the following chart, the DiseaseFree category has been selected and the other categories are not available.
To clear the filter, click .
Histograms
To filter attributes using a histogram, you have two options:
...
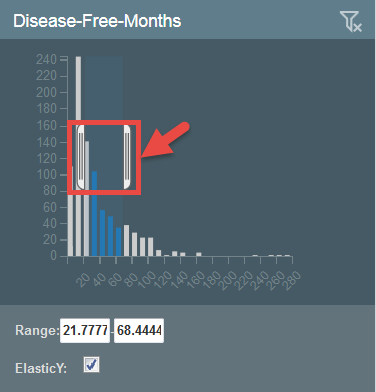
In the following histogram, a range has been selected, which exists between the brackets and appears below the graph.
 To clear the filter, click .
Understanding the Visualization Types
...