Page History
...
All of the filtering attributes appear, as well as a Download link, for downloading a spreadsheet of the data after you have (or have not) filtered it.

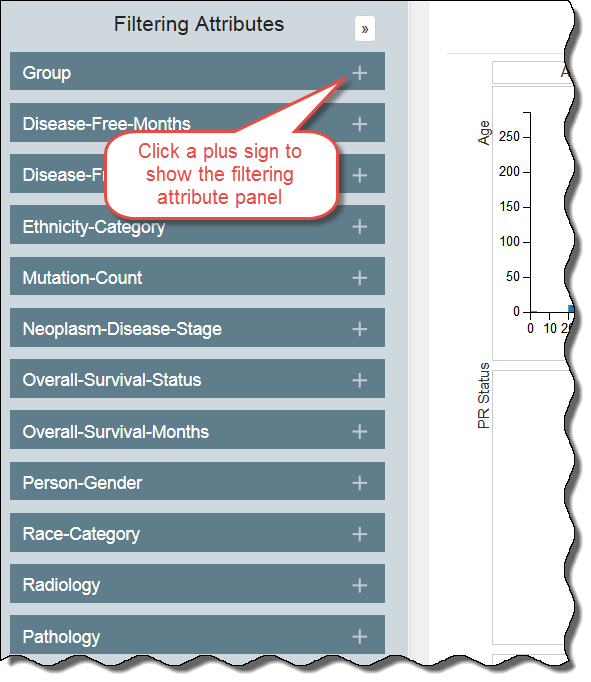
You can also continue to view the filtering attributes vertically and hide the panels you do not want to use. Hide a panel by clicking the minus sign in the panel's upper left. Show it by clicking the plus sign in the panel's upper right.
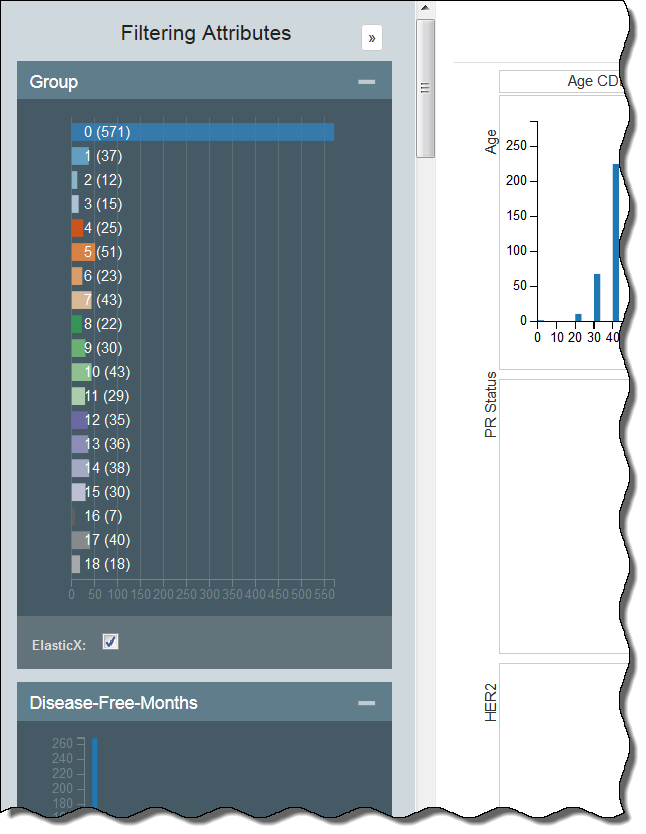
In the following example, the Group and Disease-Free Months panels are open.
In the following example, all of the filtering attribute panels are hidden.
Clearing Filters
You must clear each filter individually by clicking  in each panel. As you clear a filter, the number of records that meet your filtering criteria likely increases. You may want to note a control value, such as the number of records in the group, to illustrate the change in selected records as you apply filters.
...
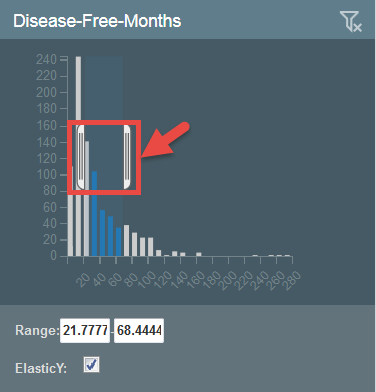
To filter attributes using a histogram, you have two options that accomplish the same thing:
- Click and drag the brackets to select a range. Click anywhere in the chart to show the brackets
- Enter the values of the range in the boxes below the graphchart.
In the following histogram, no values have been selected yet.
...
In the following histogram, a range has been selected, which exists between the brackets and appears below the graphchart.
Understanding the Visualization Types
...