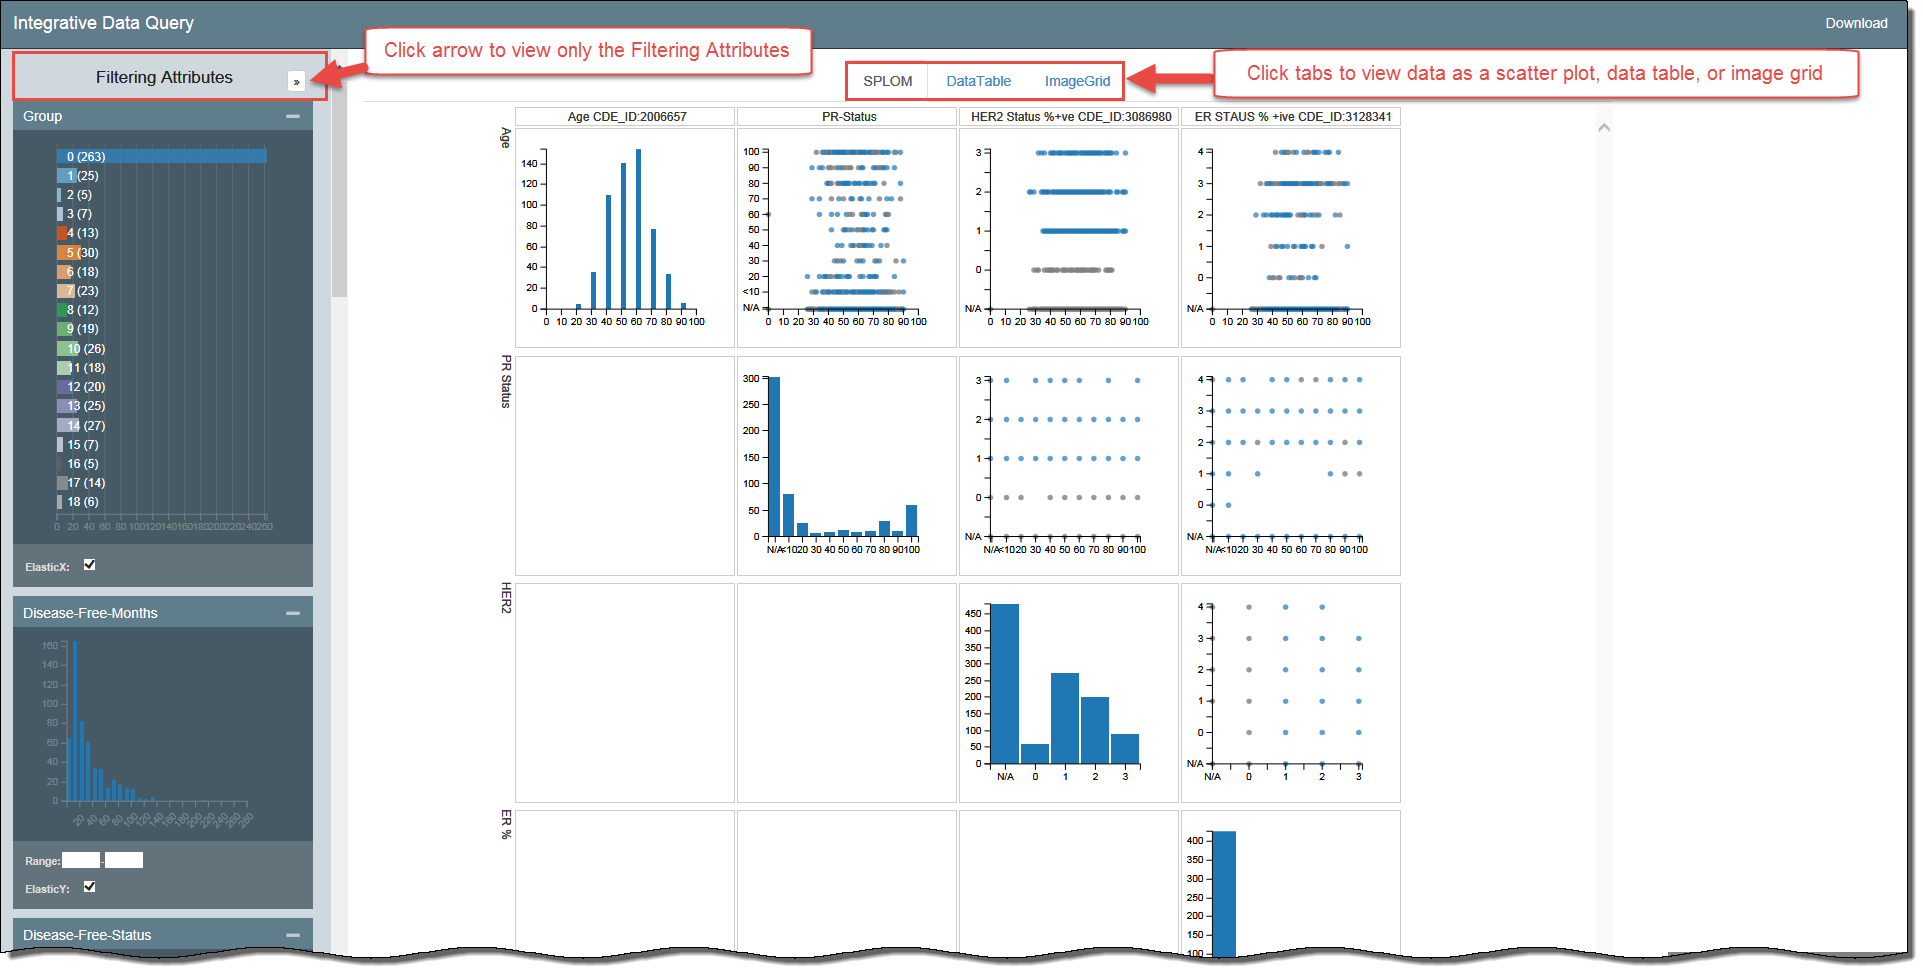
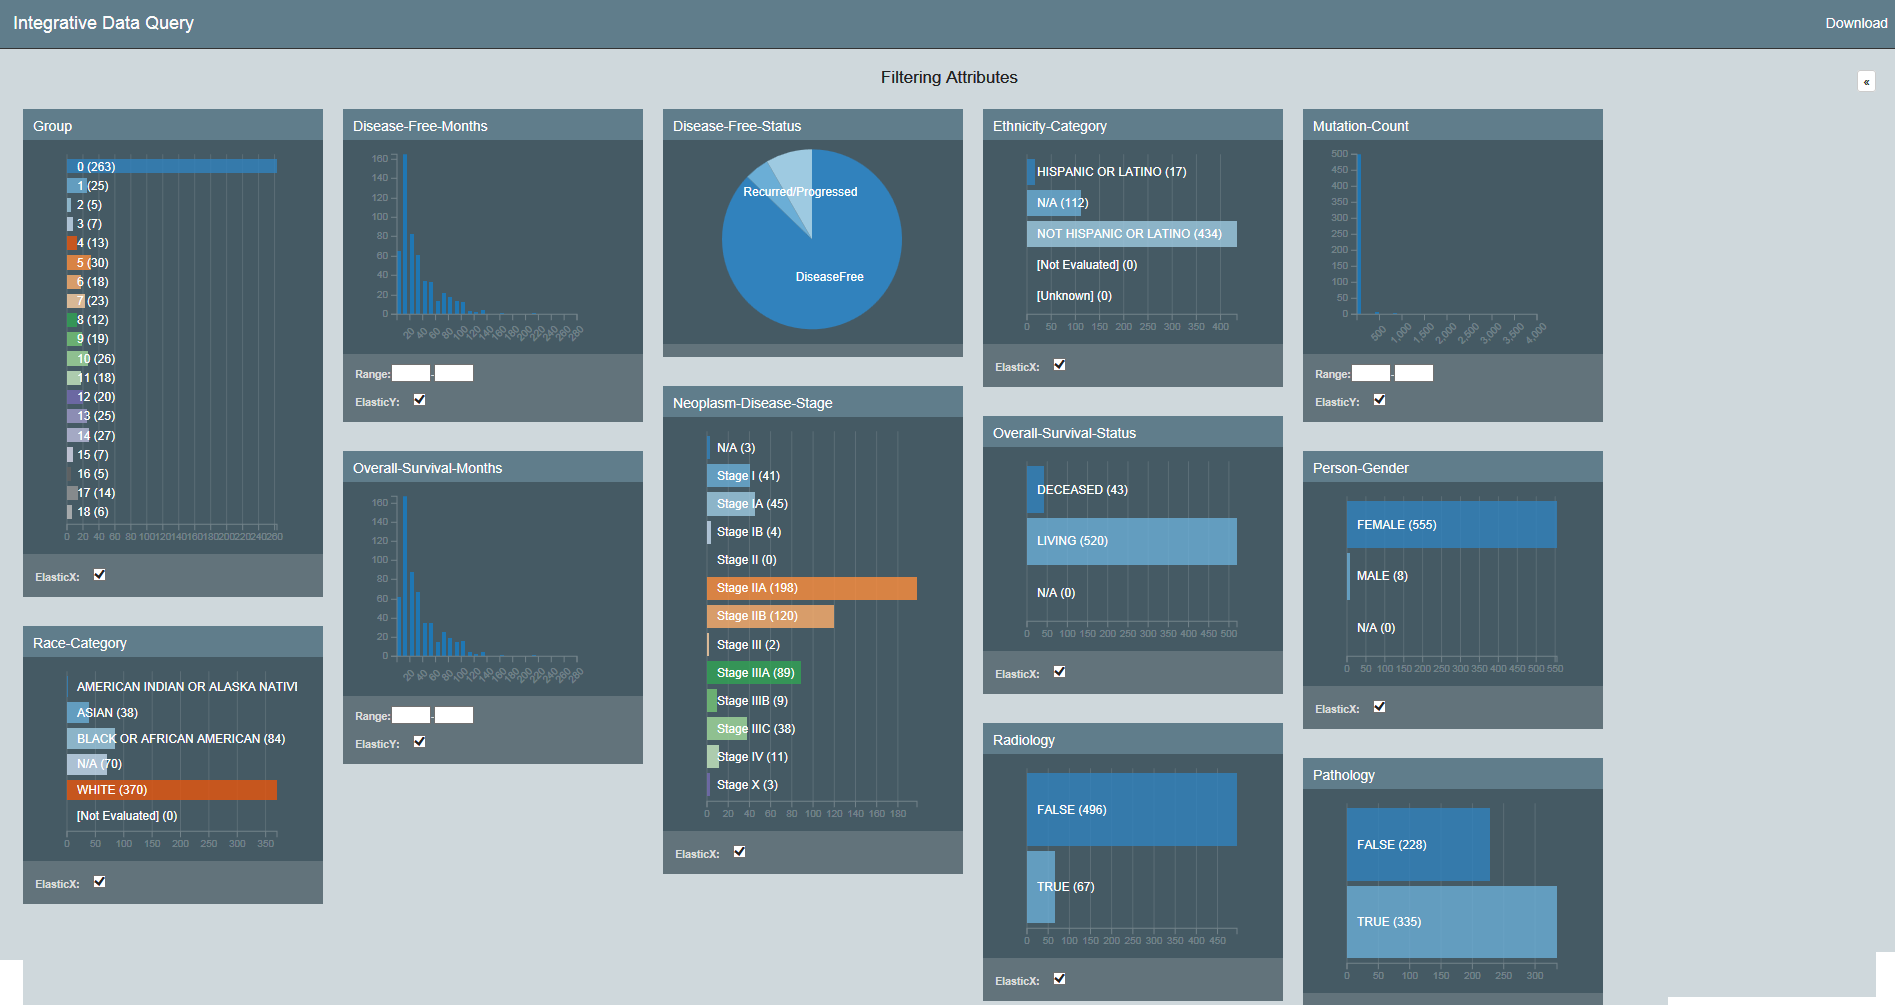
The Integrative Data Query application allows you to visualize massive amounts of data. Using interactive dashboards, you can filter the data by attributes and view your results in bubble charts, data tables, image grids, and heat maps.
Using the procedures explained in the Datascope Developer's Guide, you can customize your data set, dashboards, and visualizations.

