The Results Reporting Dashboard also provides a Results Reporting Progress pie chart. This chart reflects the data from the list of trials.
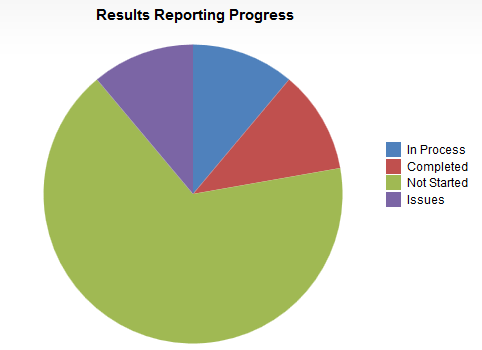
This pie chart provides the following information:
| Status | Description |
|---|---|
Not Started | Reflects all trials that don’t have dates in the Reporting In Process field. |
In Process | Reflects all trials that have dates in the Reporting In Process field, but not the Trial Results Published Date field. (Includes trials that have XML upload errors.) |
Completed | Reflects all trials that have dates in the Trial Results Published Date field. |
| Issues | Reflects all trials that have unresolved XML upload errors and that have no date in the Trial Results Published Date field. (Unresolved XML upload errors are errors that have no date in the Resolution Date field in the Summary of XML Upload Errors & Actions Taken page.) |
You can use the pie chart in the following ways:
- If you use the search fields at the top of the Results Reporting Dashboard to narrow the list of trials, the pie chart reflects the data from the list of results.
- If you add a date to the Reporting In Process field or the Trial Results Published Date field for a trial in the list and refresh your browser, the pie chart reflects that change.
- If you add a date to the Resolution Date field for a trial listed in the Summary of XML Upload Errors & Actions Taken page and return to the Results Reporting Dashboard, the pie chart reflects that change.