Page History
...
- With the appropriate study open, at the bottom of the Query Results page, click the View in Integrative Genomics Viewer button.
- If you click the button at the bottom of the page with any of the query results line items selected, caIntegrator creates IGV files, with a monitor informing you of this. After the files are created, click the Launch Integrative Viewer hypertext link.
- Follow the instructions through the intermediate dialog boxes. After clicking Open with the Java program listed, the
IGV.jnlpopens, displaying the dataset in the computer screen. An example displays in the following figure.
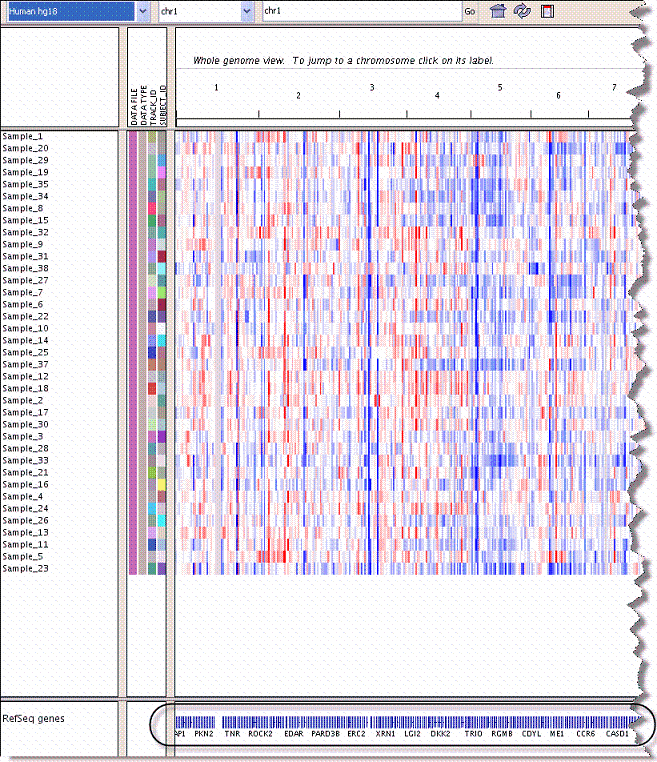
- Move your mouse to hover over the genes graphic at the bottom of the page, indicated in the figure.
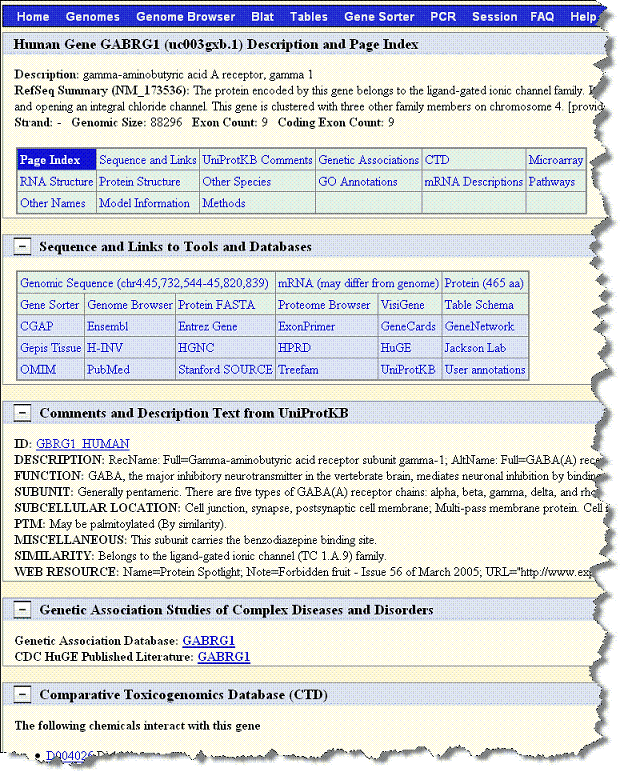
- Click the mouse when you've identified a gene of interest.
This opens the genome site at UCSC, where you can learn more about the gene. The following figures exhibits the kind of metadata you can expect from the UCSC genome site.
Method 2 IGV
- With the appropriate study open, click Integrative Genomics Viewer on the left sidebar. This opens the View IGV Selector page, shown in the following figure.
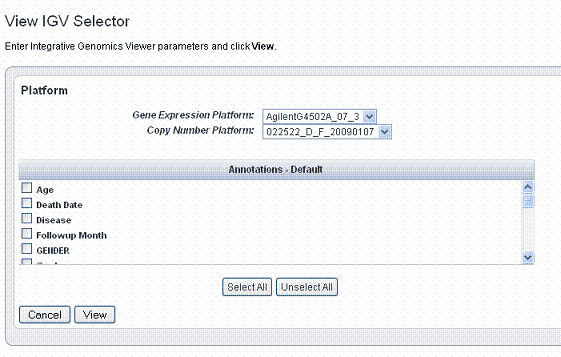
- In the drop-down list, select the Gene Expression Platform for the data you want to view.
- Select the Copy Number Platform ID.
- The Annotations - Default panel displays existing annotation fields for the gene expression data in the open study. Select those fields you want to view when you open the IGV. Use the buttons for convenience if you want to Select All or Unselect All, when all are checked.
- Click View to see the data in the Integrative Genomic Viewer. caIntegrator creates IGV files of the data.
- After the files are created, click the Launch Integrative Viewer hypertext link that appears.
- Continue with Step 3 in Method 1 IGV.
...
- With the appropriate study open, at the bottom of the Query Results page, click the View in Heat Map Viewer button.
- If you click the button at the bottom of the page with any of the query results line items selected, caIntegrator creates HMV files, with a monitor informing you of this. After the files are created, click the Launch Heat Map Viewer hypertext link.
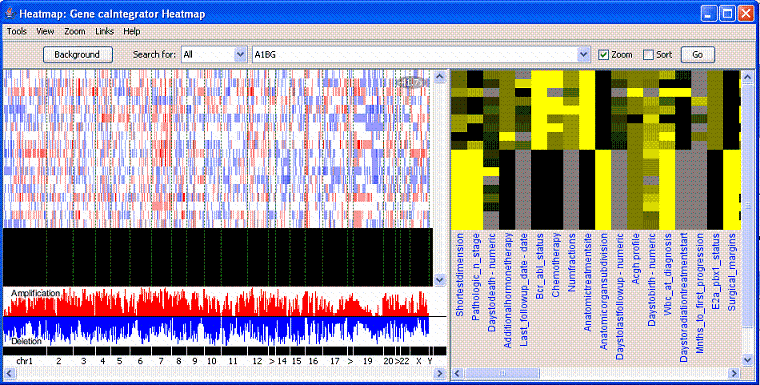
- Follow the instructions through the intermediate dialog boxes. After clicking Open with the Java program listed, the runs, displaying the dataset in the computer screen. An example displays in the following figure.
Method 2 HMV
- With the appropriate study open, click Heat Map Viewer on the left sidebar. This opens the View Heat Map Viewer Selector page, shown in the following figure.
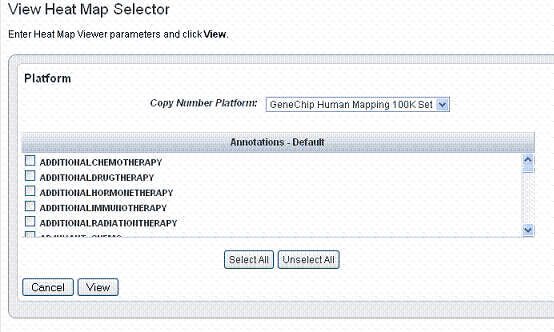
- Select the appropriate Copy Number Platform in the drop down list.
- The Annotations - Default panel displays existing annotation fields for the gene expression data in the open study. Select one or more annotations in the annotation list. For convenience, you can use the Select All or Unselect All buttons.
- Click View to view the data you select in Heat Map Viewer. caIntegrator creates Heat Map Viewer files of the data.
- After the files are created, click the Launch Heat Map Viewer hypertext link that appears.
Continue with Step 3 in Method 1 HMV.
Info title HMV help files For interpretation of the results and using HMV features, see the help files opened from HMV.
...