NIH | National Cancer Institute | NCI Wiki  

WIKI MAINTENANCE NOTICE

Please be advised that NCI Wiki will be will be undergoing maintenance on Monday, June 24th between 1000 ET and 1100 ET.
Wiki will remain available, but users may experience screen refreshes or HTTP 502 errors during the maintenance period. If you encounter these errors, wait 1-2 minutes, then refresh your page.

If you have any questions or concerns, please contact the CBIIT Atlassian Management Team.
Error rendering macro 'rw-search'

null

Versions Compared

Key

  • This line was added.
  • This line was removed.
  • Formatting was changed.

...

Anchor
maincontent
maincontent

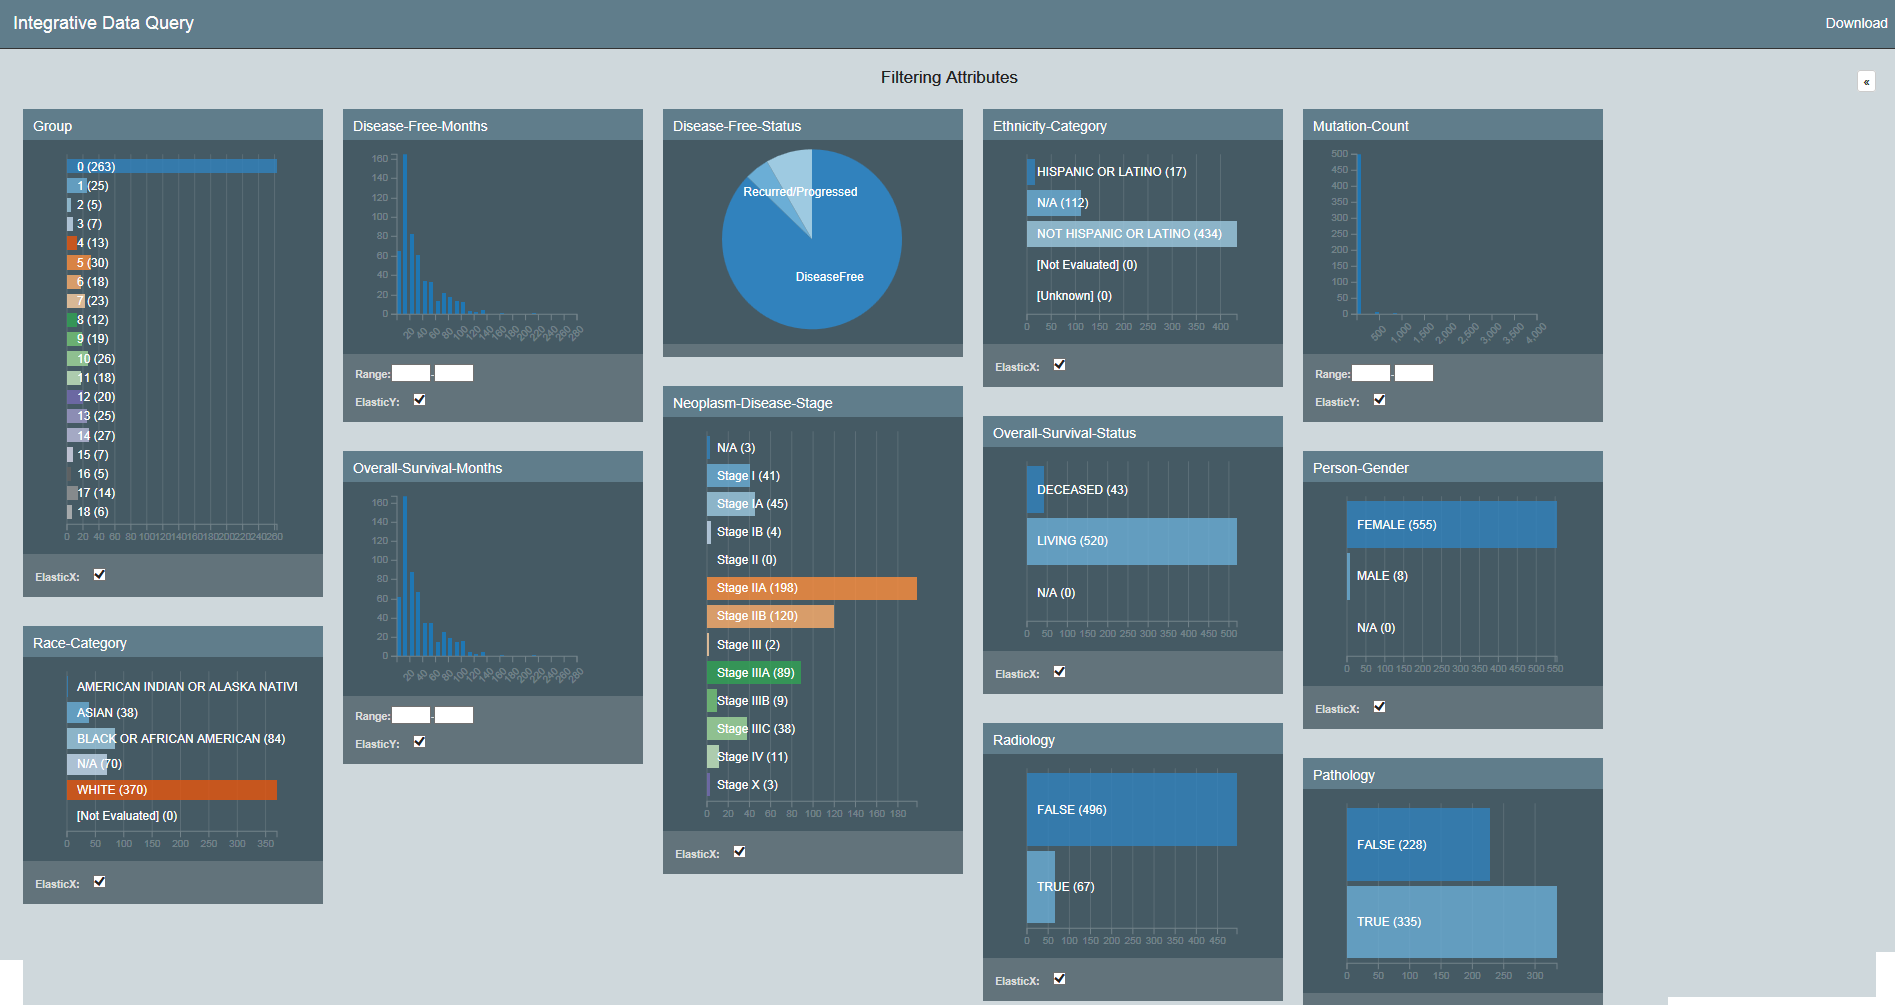
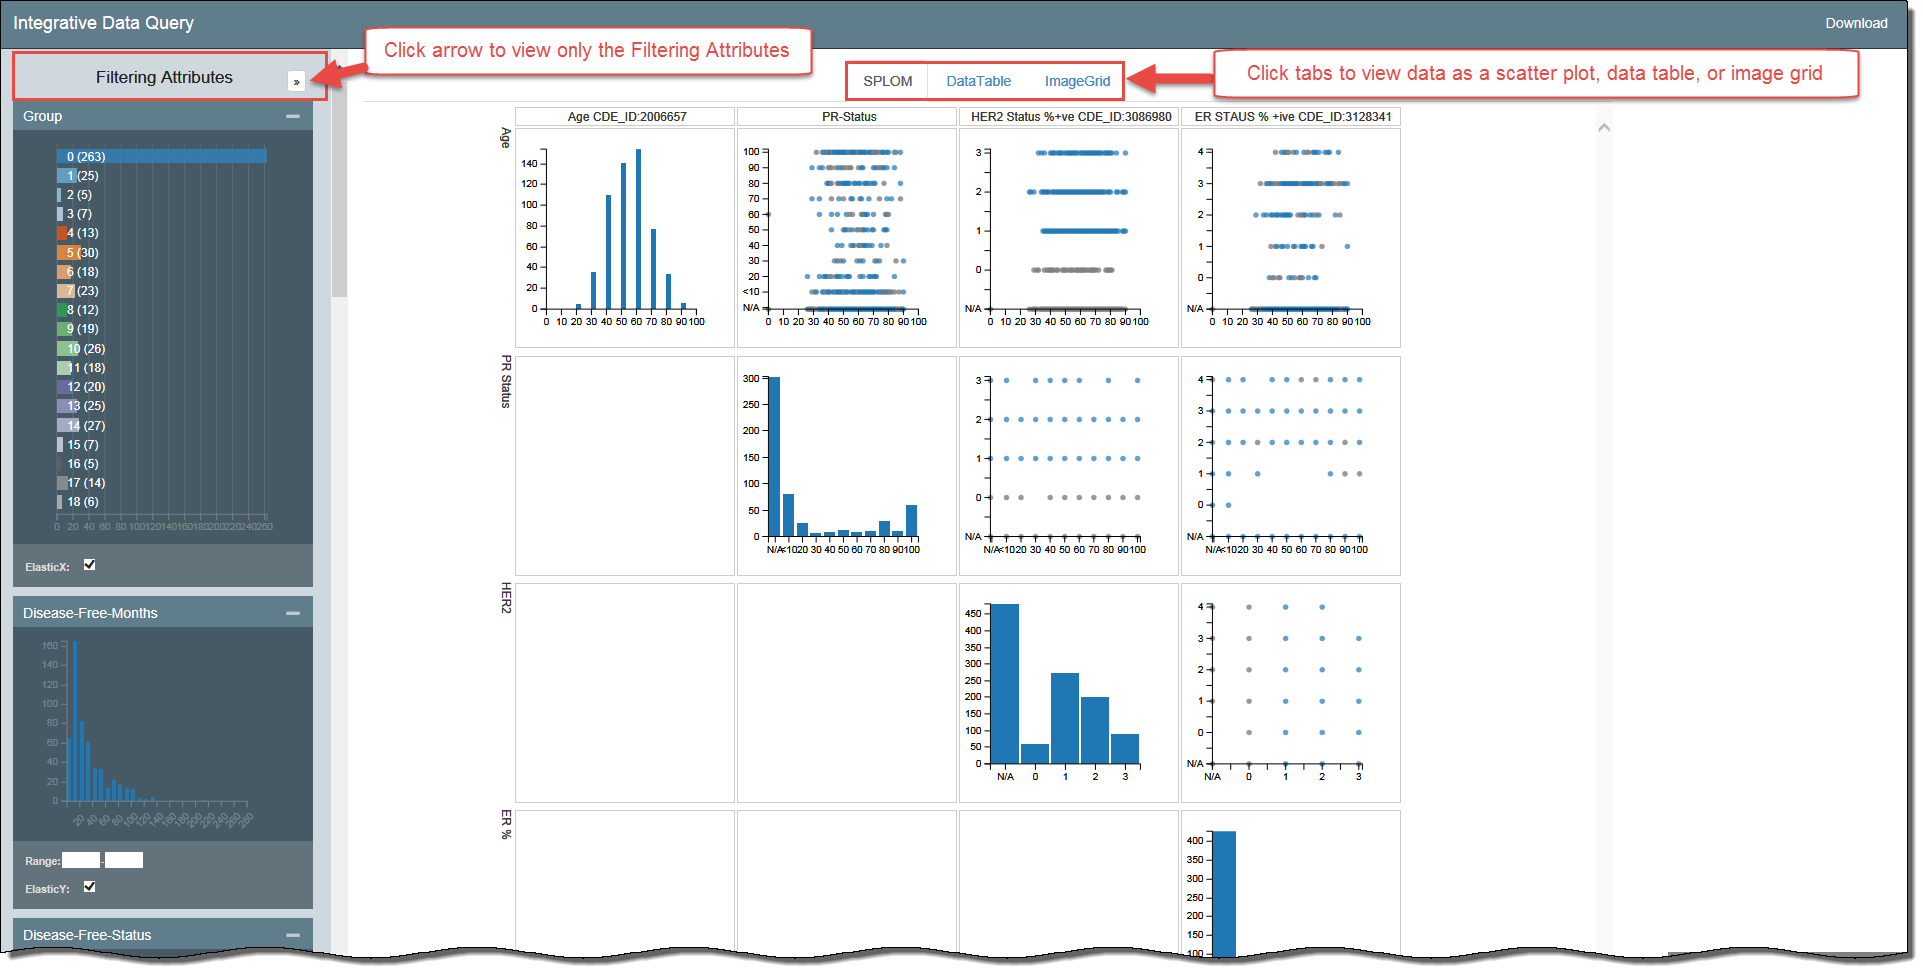
The Integrative Data Query application allows you to visualize massive amounts of data. Using interactive dashboards, you can filter the data by attributes and view your results in bubble charts, data tables, image grids, and heat maps.

Using the procedures explained in the Datascope Developer's Guide, you can customize your data set, dashboards, and visualizations.

Integrative Data Query window highlighting the arrow next to the Filtering Attributes and the three visualization tabsImage Added

Filtering Attributes of the Integrative Data Query ApplicationImage Added

Â