Page History
...
- To configure the link for accessing GenePattern from caIntegrator, open the appropriate page as described in #Analyzing Data with GenePattern.
- Select the study whose data you want to analyze in the upper right portion of the caIntegrator page.
- Click GenePattern Analysis in the left sidebar of caIntegrator. This opens the GenePattern Analysis Status page.
- Make sure GenePattern Modules is selected in the drop down list. Click New Analysis Job.
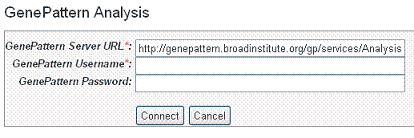
- In the GenePattern Analysis dialog box, shown in the following figure, specify connection information and click Connect. The fields are described in the corresponding tables.
Fields
Description
Server URL
Enter any GenePattern publicly available URL, such as http://genepattern.broadinstitute.org/gp/services/Analysis.
GenePattern Username
Enter your GenePattern user name.
GenePattern Password
Enter your GenePattern password.
- After logging in with the GenePattern profile, the dialog box, shown in the following figure, expands to include fields for defining the GenePattern analysis.
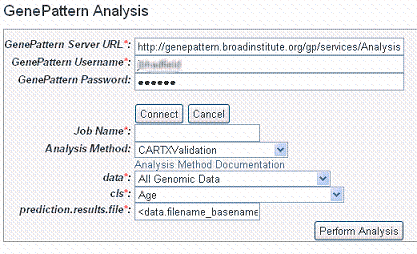
- Enter information for the following fields. Fields with a red asterisk are required.
Fields
Description
Job Name*
Enter a unique name for the analysis
Analysis Method
Select any method from the drop down list. Click Analysis Method Documentation for descriptions of the different analysis methods.
Data
All genomic data is selected by default. Select from the list any list that has been created for this study.
cls
Select any annotation field.
The CLS file format defines phenotype (class or template) labels and associates each sample in the expression data with a label. It uses spaces or tabs to separate the fields. The CLS file format differs somewhat depending on whether you are defining categorical or continuous phenotypes:
Categorical labels define discrete phenotypes; for example, normal vs tumor).
Continuous phenotypes are used for time series experiments or to define the profile of a gene of interest (gene neighbors).Info title Note Most GenePattern modules are intended for use with categorical phenotypes. Therefore, unless the module documentation explicitly states otherwise, a CLS file should define categorical labels.
...
prediction.results.file
Enter the name of this file which is part of the output from a GenePattern module.
- Click Perform Analysis. Based on the analysis method you select, you may be asked to add more information for the analysis. For more information, refer to the GenePattern Help site: http://genepattern.broadinstitute.org/gp/getTaskDocCatalog.jsp.90
...
- Select the study whose data you want to analyze in the upper right portion of the caIntegrator page. You must select a study saved as a subject annotation study, but which has genomic data.
- Click GenePattern Analysis in the left sidebar of caIntegrator. This opens the GenePattern Analysis Status page.
- In the GenePattern Analysis Status page, select Comparative Marker Selection (Grid Service) from the drop down list and click New Analysis Job. This opens the Comparative Marker Selection Analysis page, shown in the following figure.
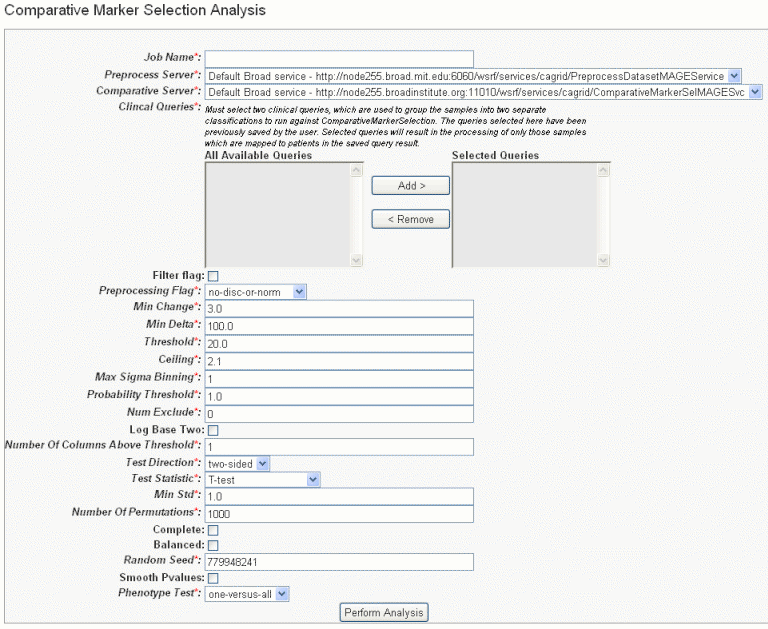
- Select or define CMS analysis parameters, described in the following table. An asterisk indicates required fields. The default settings are valid; they should provide valid results.
CMS Parameter
Description
Job Name*
Assign a unique name to the analysis you are configuring.
Preprocess Server*
A server which hosts the grid-enabled data GenePattern PreProcess Dataset module. Select one from the list and caIntegrator will use the selected server for this portion of the processing.
Comparative Server*
A server which hosts the grid-enabled data GenePattern Comparative Marker Selection module. Select one from the list and caIntegrator will use the selected server for this portion of the processing.
Annotation Queries and Lists*
All subject annotation queries and gene lists with appropriate data for the analysis are listed. Select and move two or more queries from the All Available Queries panel to the Selected Queries panel using the Add > and Remove < buttons.
<ac:structured-macro ac:name="unmigrated-wiki-markup" ac:schema-version="1" ac:macro-id="553a11fe4b695134-e29430b9-4f304a74-bb71aff5-f9074c76f76aecba2dbecd89"><ac:plain-text-body><![CDATA[Note: The [SL] and [Q] prefixes to list names indicate "Subject Lists" or "Saved Queries". A "G" in the prefix indicates the list is Global. For more information, see [Creating a Gene or Subject Listhttps://wiki.nci.nih.gov/x/FoDnAg#4-ViewingQueryResults-CreatingaGeneorSubjectList].
]]></ac:plain-text-body></ac:structured-macro>
Filter Flag
Variation filter and thresholding flag
Preprocessing Flag*
Discretization and normalization flag
Min Change*
Minimum fold change for filter
Min Delta*
Minimum delta for filter
Threshold*
Value for threshold
Ceiling*
Value for ceiling
Max Sigma Binning*
Maximum sigma for binning
Probability Threshold*
Value for uniform probability threshold filter
Num Exclude*
Number of experiments to exclude (max & min) before applying variation filter
Log Base Two
Whether to take the log base two after thresholding; default setting is "Yes".
Number of Columns Above Threshold*
Remove row if n columns are not >= than the given threshold
In other words, the module can remove rows in which the given number of columns does not contain a value greater or equal to a user defined threshold.Test Direction*
The test to perform (up-regulated for class0; up-regulated for class1, two sided). By default, Comparative Marker Selection performs the two-sided test.
Test Statistic*
Select the statistic to use.
Min Std*
The minimum standard deviation if test statistic includes the min std option. Used only if test statistic includes the min std option.
Number of Permutations*
The number of permutations to perform. (Use 0 to calculate asymptotic P-values.) The number of permutations you specify depends on the number of hypotheses being tested and the significance level that you want to achieve (3). The greater the number of permutations, the more accurate the P-value.
Complete – Perform all possible permutations. By default, complete is set to No and Number of Permutations determines the number of permutations performed. If you have a small number of samples, you might want to perform all possible permutations.
Balanced – Perform balanced permutationsRandom Seed*
The seed for the random number generator.
Smooth P-values
Whether to smooth P-values by using the Laplace's Rule of Succession. By default, Smooth P-values is set to Yes, which means P-values are always less than 1.0 and greater than 0.0.
Phenotype Test*
Tests to perform when class membership has more than 2 classes: one versus-all, all pairs.
Note: The P-values obtained from the one-versus-all comparison are not fully corrected for multiple hypothesis testing.- Comparative Marker Selection analysis options
Anchor RTF31353237303a205461626c65 RTF31353237303a205461626c65
- Comparative Marker Selection analysis options
...
- Select the study whose data you want to analyze in the upper right portion of the caIntegrator page. You must select a study with copy number (either Affymetrix SNP or Agilent Copy Number) data.
- Click GenePattern Analysis in the left sidebar of caIntegrator. This opens the GenePattern Analysis Status page.
- In the GenePattern Analysis Status page, select GISTIC (Grid Service) from the drop down list and click New Analysis Job. This opens the GISTIC Analysis page, shown in the following figure.
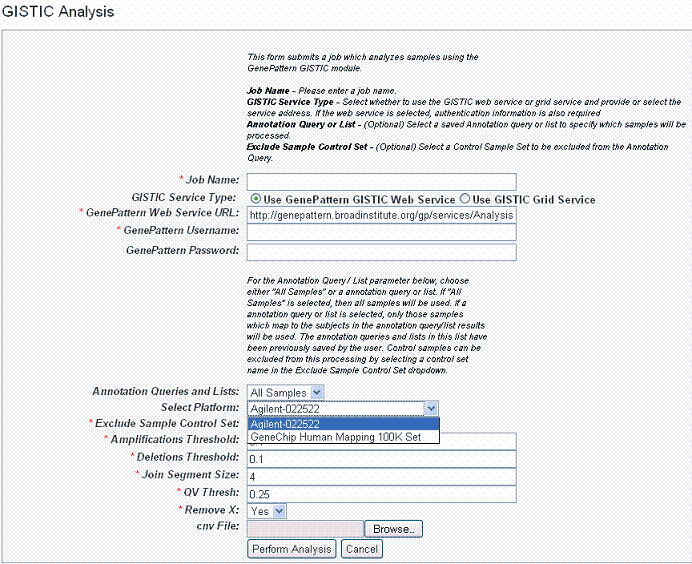
- Select or define GISTIC analysis parameters, as described in the following table. You must indicate a Job Name, but you can accept the other defaults settings, which are valid and should produce valid results.
GISTIC Parameters
Description
Job Name*
Assign a unique name to the analysis you are configuring.
GISTIC Service Type*
Select whether to use the GISTIC web service or grid service and provide or select the service address. If the web service is selected, authentication information is also required
GenePattern User Name/Password
Include these to log into GenePattern for the analysis.
Annotation Queries and Lists
All annotation queries display in this list as well as an option to select all non-control samples. Select an annotation query if you wish to run GISTIC on a subset of the data and select all non-control samples if wish to include all samples.
Select Platform
This option appears only if more than one copy number platform exists in the study. Select the appropriate platform from the drop-down list ().
Exclude Sample Control Set
From the drop-down list, select the name of the control set you want to exclude from the analysis. Click None if that is applicable.
Amplifications Threshold*
Threshold for copy number amplifications. Regions with a log2 ratio above this value are considered amplified. Default = 0.1.
Deletions Threshold*
Threshold for copy number deletions. Regions with a log2 ratio below the negative of this value are considered deletions. Default = 0.1.
Join Segment Size*
Smallest number of markers to allow in segments from the segmented data. Segments that contain fewer than this number of markers are joined to the neighboring segment that is closest in copy number. Default = 4.
<ac:structured-macro ac:name="unmigrated-wiki-markup" ac:schema-version="1" ac:macro-id="8eb027e47bbefd89-066c501f-439c4eaf-a6c88a86-f3772affbf8a24e818e9eeeb"><ac:plain-text-body><![CDATA[
QV Thresh[hold]*
Threshold for q-values. Regions with q-values below this number are considered significant. Default = 0.25.
]]></ac:plain-text-body></ac:structured-macro>
Remove X*
Flag indicating whether to remove data from the X-chromosome before analysis. Allowed values = {1,0}. Default = 1(yes).
cnv File
This selection is optional.
Browse for the file. There are two options for the CNV file.
Option #1 enables you to identify CNVs by marker name. Permissible file format is described as follows:
A two column, tab-delimited file with an optional header row. The marker names given in this file must match the marker names given in the markers_file. The CNV identifiers are for user use and can be arbitrary. The column headers are:
...