Page History
...
- Select the study whose data you want to analyze in the upper right portion of the caIntegrator page. You must select a study saved as a subject annotation study, but which has genomic data.
- Under Analysis Tools on the left sidebar, select Gene Expression Plot.
Select the For Annotation Queries and Saved Lists tab, shown in the following figure. Plot criteria are described in the table following the figure.
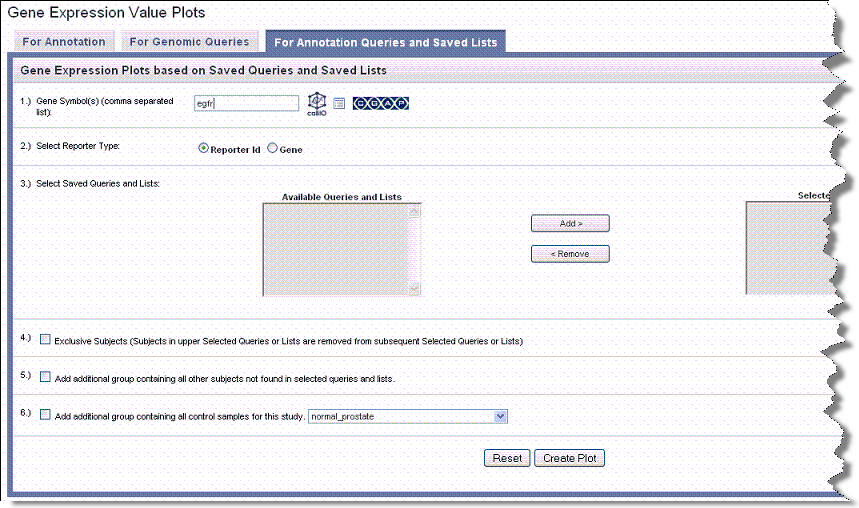
Field Description Gene Symbol
Include Page Gene Symbol Gene Symbol Reporter Type
Select the radio button that describes the reporter type:
Reporter ID – Summarizes expression levels for all reporters you specify.
Gene Name – Summarizes expression levels at the gene level.Platform
This field displays only if the study has multiple platforms. Select the appropriate platform for the plot. The platform you select determines the genes used for the plot.
Saved Queries
Choose among the available saved queries and lists. Build your selections in the right panel by using the Add > and Remove < buttons.
Info title Prefixes for lists The [SL] and [Q] prefixes to list names indicate "Subject Lists" or "Saved Queries". A "G" in the prefix indicates the list is Global. For more information, see Creating a Gene or Subject List.
Exclusive Subjects...
To remove subjects in your queries and lists selection from queries or lists you use subsequently for analysis, check the button. This allows you to use them exclusively for the current analysis.
Add Additional Group...
Define as follows:
...all other subjects – Check the box to create an additional group of all other subjects that are not in selected query groups.
...control group – Check the box to display an additional group of control samples for this study. The control set should be composed of only samples which are mapped to subjects. See Uploading Control Samples.- Click the Create Plot button.
...