The next several sections analyze available statistics for direct use of EVS resources on EVS servers. This section covers direct use of NCI-hosted EVS terminology browsers and the LexEVS local java API that supports them. Later sections cover the LexEVS distributed (remote), LexEVS caGrid services, the term suggestion site, and ftp download services.
The EVS browsers and LexEVS APIs at NCI are covered by the AWStats and Wusage applications, recording various statistics including number of unique visitors, visits, number of pages viewed and data volume accessed. These have been collected below to give a window into the use of the EVS services. Appendix 1 lists the usage tracking pages from which these statistics are gathered.
We are now able to identify and exclude most web crawler and similar automated hits, as well as internal use for testing and development purposes. Detailed examination of addresses and patterns of use suggest that the use reported below overwhelmingly represents real users from NCI and other organizations of interest. Analyzed below are figures for unique visitors and number of visits, as well as the volume of data communicated, which for all but ftp sites reflects high volumes of traffic in mostly compact units of terminology concept data.
Statistical Overview
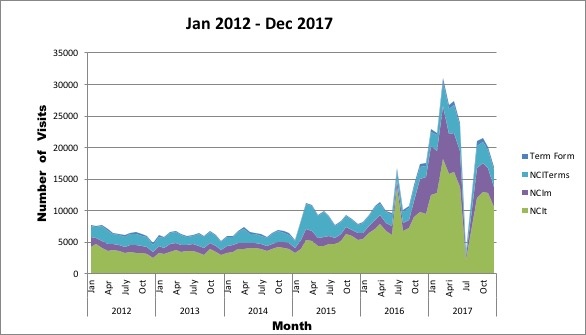
The EVS browsers run off the LexEVS local API, and provide the highest number of direct users of EVS terminology servers. The lowest, but most informative, numbers are for unique visitors and number of visits. The number of unique visitors to the EVS family of browsers has averaged around 4,000 per month in 2015, growing to around 10,000 per month by the end of 2016 generating some 17,000 visits.
Unique visitors to EVS browsers, per month
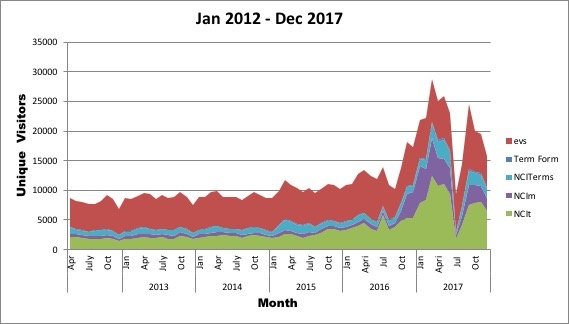
Key
Abbreviation
Site
NCITerms
NCI Term Browser (many terminologies, value sets and mappings)
NCIt
NCI Thesaurus Browser (now one face of NCITerms, counted separately)
NCIm
NCI Metathesaurus Browser (separate app, searchable from NCITerms)
TermForm
EVS Term Suggestion site (covered later)
Number of visits to EVS browsers, per month
Browser Users
The data below is from January - December 2015. It shows an overall view of which internet domains hit EVS browsers most heavily, and then breaks down each domain by top users. All browsers are put together for this analysis.
Overall Use
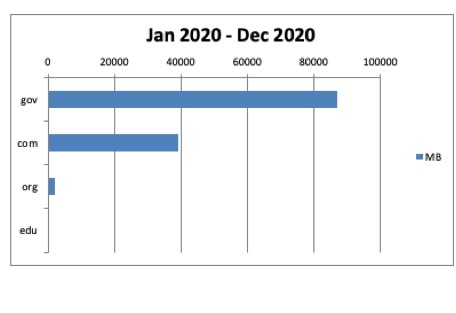
The amount of bandwidth used was divided into four (4) major groups: Government .gov users, private .com and .net users, Educational .edu institutions, and Organizations .org. The data was analyzed and bots were discarded to avoid skewing the data.
Data accessed (MB) from EVS browsers by domain
Domain | MB |
|---|---|
gov | 20687 |
com | 7807 |
org | 2721 |
edu | 1077 |
Data accessed (MB) from EVS browsers by domain
Users from .gov domain
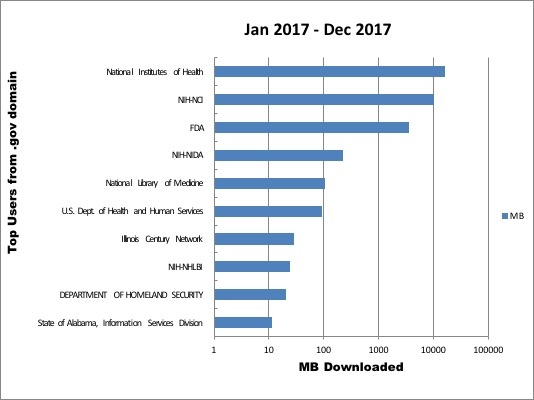
The numbers below show the top government users of the EVS browsers, as measured by the MB of data that were accessed. Agency names have been provided where they are known. The main users are internal to NCI and NIH, which is not surprising, but we have substantial FDA usage as well.
Top .gov EVS browser users: Data accessed (MB)
Organization | MB |
|---|---|
| National Institutes of Health | 15582 |
| NIH-NCI | 4660 |
| FDA | 198 |
| U.S. Dept. of Health and Human Services | 91 |
| National Library of Medicine | 50 |
| Illinois Century Network | 28 |
| State of Minnesota | 28 |
| State of Oregon | 27 |
| NIH-NHLBI | 23 |
| NIH-NIDA | 9 |
Top .gov EVS browser users: Data accessed (MB)
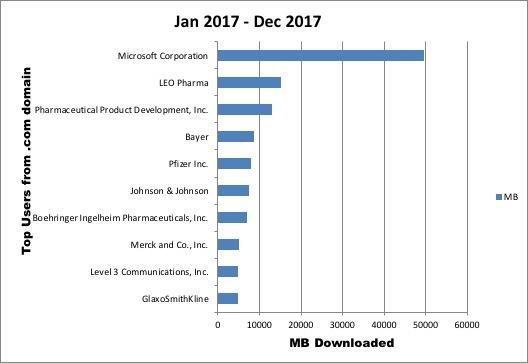
Users from .com domain
We combined the .net and .com users into one group as both contained a number of private corporations and individual users from a wide variety of internet service providers (ISPs). Business names have been provided where known. The graph below does not show ISPs as they are not interpretable and dwarf the next largest groups.
Top .com EVS browser users: Data accessed (MB)
Business | MB |
|---|---|
| IBM | 564 |
| PSINet, Inc. | 280 |
| Hoffmann LaRoche, Inc. | 257 |
| Spartanburg Regional Health Services District, Inc. | 154 |
| REED ELSEVIER | 140 |
| GlaxoSmithKline | 123 |
| Roche | 104 |
| IBM Rochester | 92 |
| Johnson & Johnson | 85 |
| McKesson | 77 |
Top .com EVS browser users: Data accessed (MB)
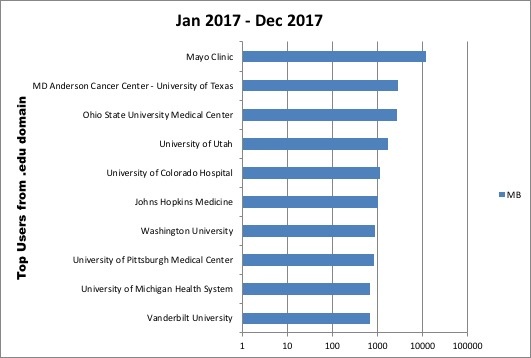
Users from .edu domain
The edu users were widely distributed across many American universities and a small selection of foreign institutions.
Top .edu EVS browser users: Data accessed (MB)
Institution | MB |
|---|---|
| Mayo Clinic | 441 |
| Vanderbilt University | 286 |
| New Jersey Institute of Technology | 272 |
| University of California, San Diego | 118 |
| University of Geneva | 92 |
| University of Muenster | 64 |
| University of Berlin - Charite | 51 |
| Massachusetts Institute of Technology | 49 |
| University of Pennsylvania Health System | 49 |
| Roosevelt University | 38 |
Top .edu EVS browser users: Data accessed (MB)
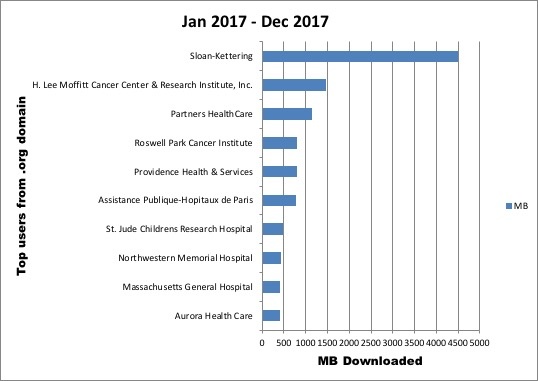
Users from .org domain
Like the .edu users, the .org users were widely distributed across a variety of organizations.
Top .org EVS browser users: Data accessed (MB)
Organization | MB |
|---|---|
| Sloan-Kettering | 340 |
| The National Marrow Donor Program | 178 |
| Kaiser Foundation Health Plan | 136 |
| Sanger Institute | 96 |
| The Fred Hutchinson Cancer Research Center | 81 |
| Dana-Farber Cancer Institute | 62 |
| Roswell Park Cancer Institute | 50 |
| Federal Institute for Drugs and Medical Devices, Germany | 48 |
| The European Bioinformatics Institute | 41 |
| The Jackson Laboratory | 38 |
Top .org EVS browser users: Data accessed (MB)
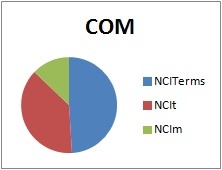
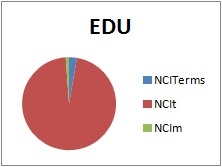
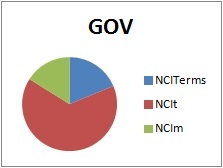
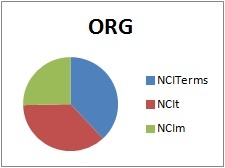
Usage Patterns of the Three EVS Browsers
The three browsers offered by EVS are
| NCITerms | NCI Term Browser: Access to all terminologies, value sets and mappings. |
|---|---|
| NCIt | NCI Thesaurus Browser: Now just one face of NCITerms, but the most used and counted separately. |
| NCIm | NCI Metathesaurus Browser: A separate application, searchable from NCITerms. |
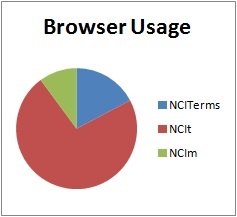
Nearly 75% of all use goes to the NCIt browser, including almost all use from the educational domain and two thirds of government use. By contrast, half of commercial domain use goes to NCI Terms, while .org use is almost evenly split between all three browsers.