Investigation-Study-Assay tab-delimited format (ISA-Tab) is a format based on the ISA-TAB specification  that is used to capture and communicate the complex metadata required to interpret investigations (experiments) employing combinations of technologies. Metadata in ISA-Tab format facilitates standards-compliant collection, curation, management, and reuse of datasets in a wide variety of life science domains. ISA-TAB builds on the existing paradigm that is Microarray Gene Expression - Tabular format (MAGE-TAB)-a tab-delimited format to exchange microarray data.
Investigations, Studies, and Assays are the three entities around which the ISA-Tab framework is built. Investigation is a higher-order object, whose primary role is to group related Studies. Study is the central unit, containing information on the subject under study, its characteristics and any treatments applied. A Study has associated Assays. Assays are measurements performed either on the whole initial subject or on a sample taken from the subject, which produce qualitative or quantitative data. Assays can be characterized as the smallest complete unit of experimentation producing data associated with a subject.
The ISA-Tab specification relies on the ISA data model to order and classify the metadata. The ISA data model uses the following three types of text files to capture the metadata:
- The Investigation file contains all of the information needed to understand the project context, overall goals, and means. An Investigation is a high-level concept that groups related Studies.
- The Study file(s) includes information on the subject under study, its characteristics, and any treatments applied. A Study is the central unit and has associated Assays.
- The Assay file(s) include test steps and analytical measurements. An Assay is a test performed either on material taken from the subject or the whole initial subject, which produces qualitative and quantitative measurements (data).
Each of these files is a tab-delimited text file that researchers can create, view, and edit.
The following diagram shows the structure of the ISA data model.
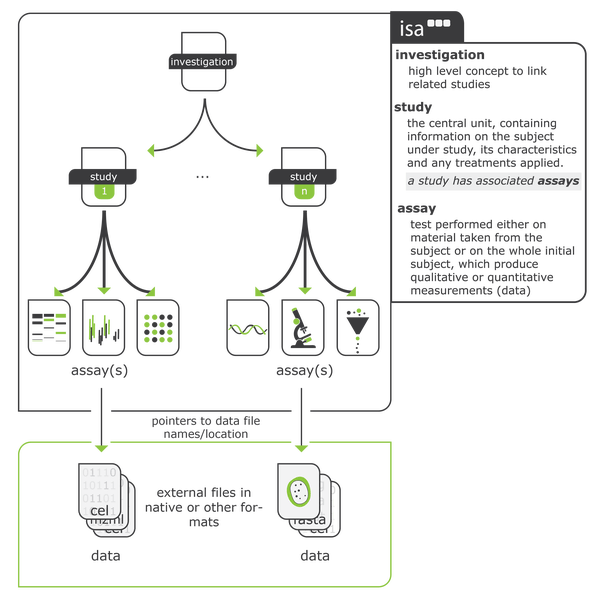
Source: ISA-Tools.org 