Topics on this page describe how to use the National Biomedical Imaging Archive (NBIA) Radiology Portal to search local and remote image databases for radiologic images.
You can print and export this user guide.
Introduction to the NBIA Radiology Portal
The NBIA Radiology Portal enables you to search for images in the local NBIA in vivo image repository. If available, you can also search remote imaging archives.
NBIA submissions are organized in the following hierarchy, which is important to remember in creating your search query and reviewing search results:
Collection > Patient (Subject) > Study > Series > Images |
|---|
In other words, a collection is the largest organizing concept within NBIA and it includes data about patients (also called subjects). As you continue to drill down to more granular concepts, patients contain studies, studies contain (image) series, and series contain individual images.
Browser Support
NBIA supports the latest versions of Google Chrome and Mozilla Firefox browsers.
Searching for Image Studies
You can search and download public data without logging in to the NBIA Radiology Portal. To access restricted data, however, you must log in first to see that data in your search results.
TCIA provides two ways to search for image studies:
When you first open the NBIA Radiology Portal, the Summary tab displays filters for a simple search and pie charts showing counts of collections, image modalities, and anatomical sites in the database. Each pie "slice" is a filter you can use to narrow the data in the portal. Hover over a pie chart slice to view the name of each filter. The size of each pie slice is relative to the size of that filter's representation in the database.

Click one or more boxes next to each search filter to select it. As you select search filters, they move to the top of the list. They also appear in Boolean query format above the pie charts. This query specifies the filters you have applied to your search. Click Clear if you want to remove all of your filters at once and start over. You can save your query as a URL for later use or to put in an email to a colleague. For more information about sharing, go to Sharing a Query and Sharing Data in Your Cart.
You can narrow your search by the following filters:
- Collections
- Image Modality
- Anatomical Site
- Species
- Phantoms
- 3rd-Party Analysis Results
- Clinical Time Points
- Exclude collections with commercial use restrictions
- Date Released
- Subject IDs
You can also specify the minimum number of image studies you want to match each search filter. For Collections, if you know the name of the collection, click ![]() to enter it instead of finding and clicking the collection's box.
to enter it instead of finding and clicking the collection's box.
3rd-party analysis results are derived data (e.g. segmentations) that were contributed by researchers who were not part of the group that originally submitted a collection to TCIA.
The Simple Search page shows a summary of image studies that match your search criteria. Your selections appear in the following ways:
- Boxes you selected are checked.
- Pie charts update to show the exact search results.
- Breadcrumb-style labels at the top of the page show the applied search filters (not all may display due to space constraints).
- Count of search results appears.
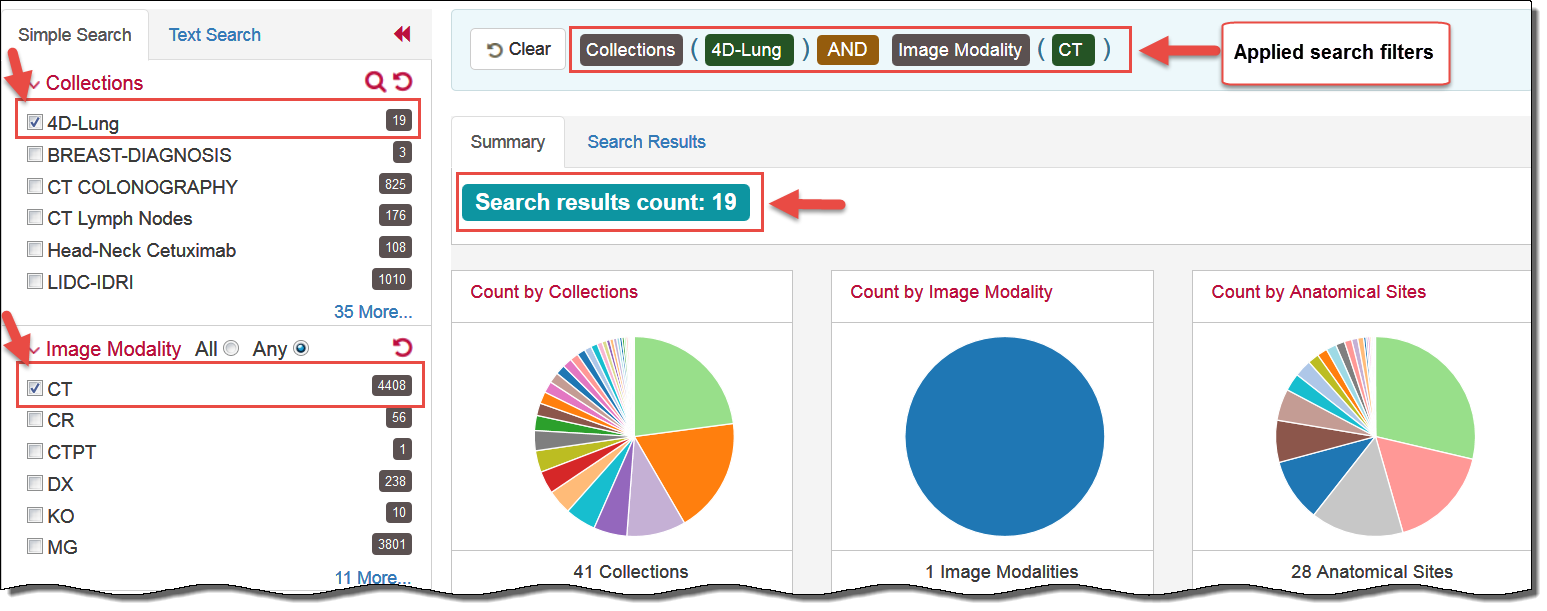
The pie charts show the count of image studies in your search results by Collection, Image Modality, and Anatomical Site. Click a pie slice or hover over it to see the name of the Collection, Image Modality, or Anatomical Site, and number of each, in your search results.

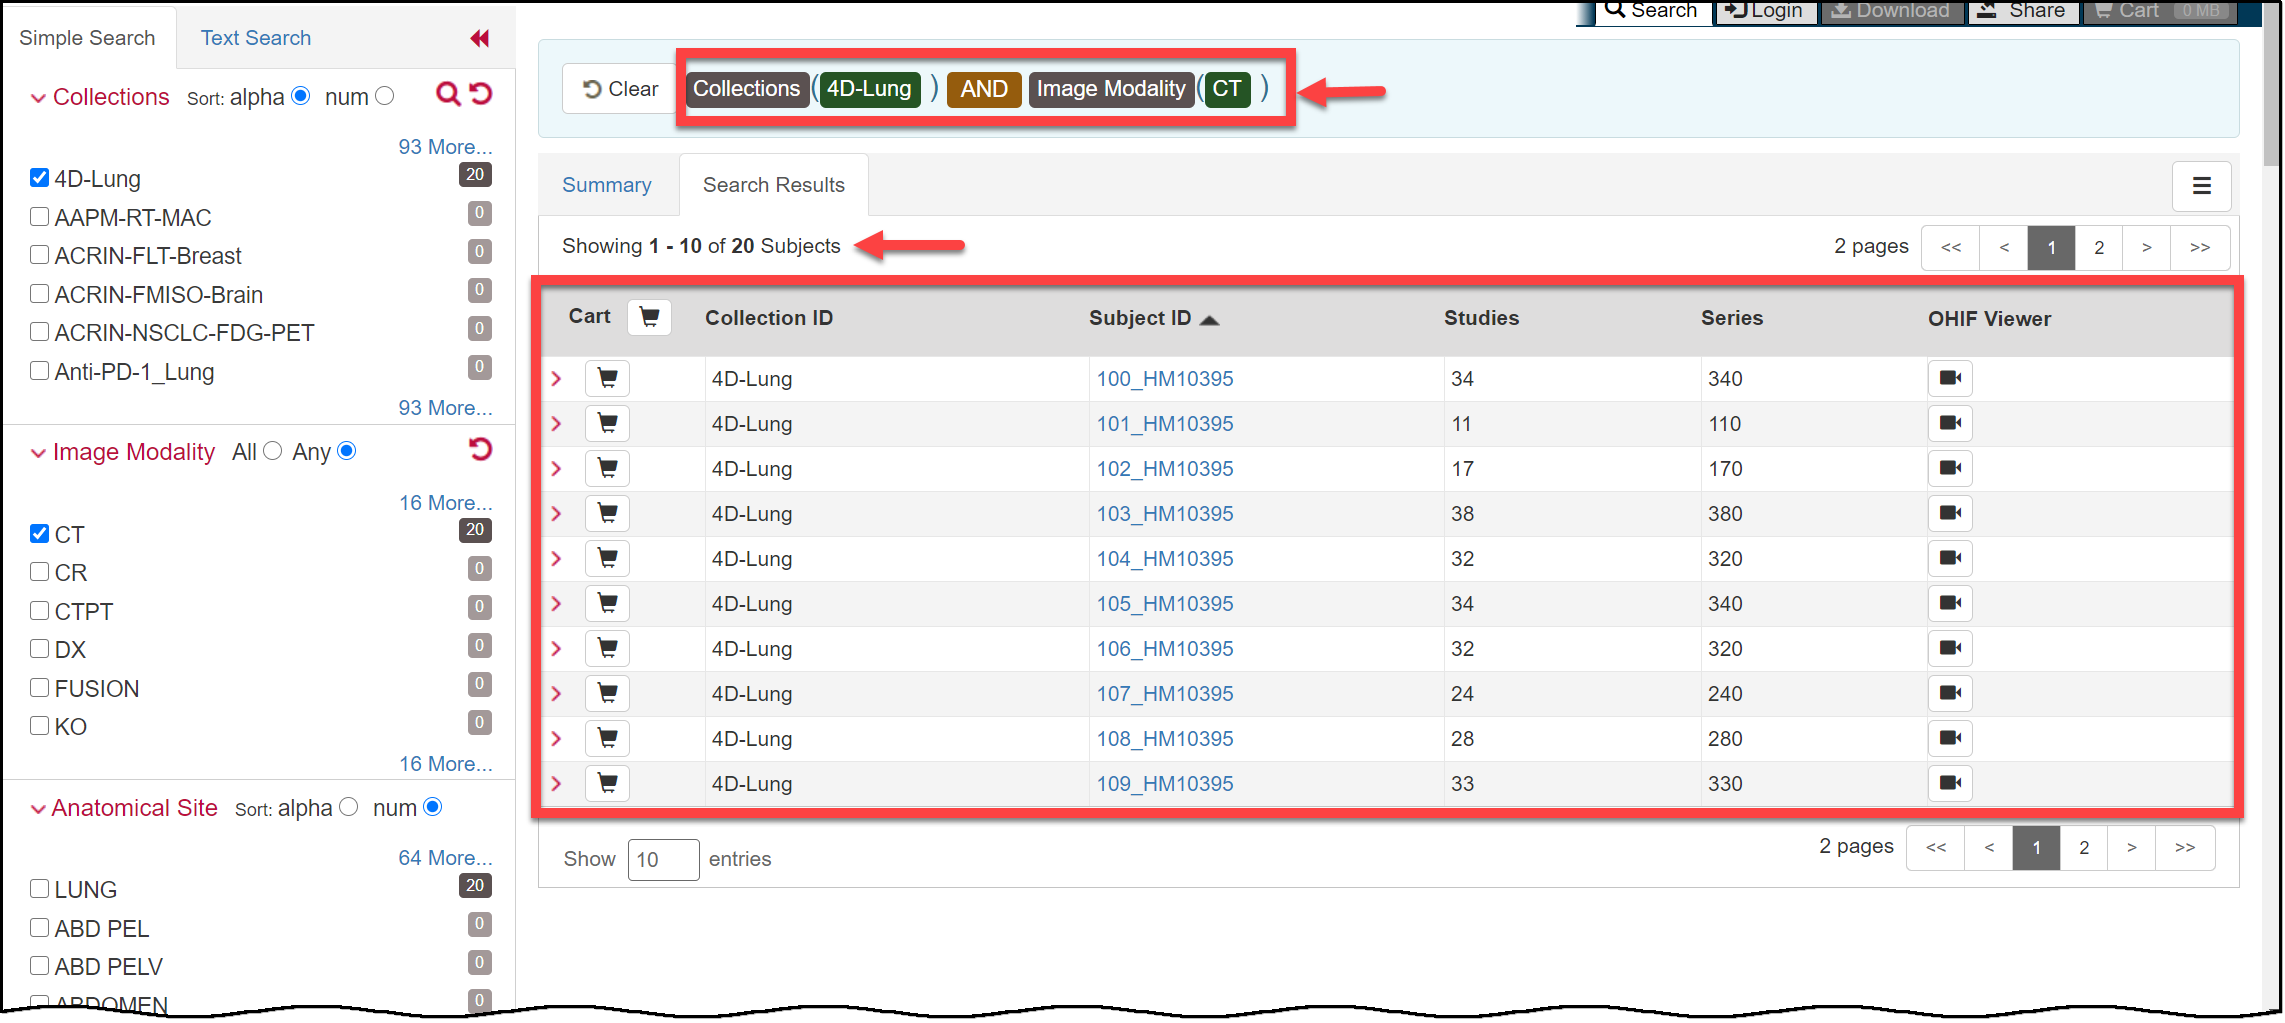
The Search Results tab shows the same results as the pie charts but in tabular form.
Text searches involve entering any text that might appear in any search filter.

Results are displayed in pie charts and a table, just as with the simple search.
Accessing Limited-Access Collections
You can search and download public data without logging in to the NBIA Radiology Portal. To access restricted data, however, you must log in first to see that data in your search results. Consult the TCIA Collections page to learn which collections have limited access.
- In the top menu bar, click
 .
.
The Login window appears.
- Enter your user name and password, then click Log In.
Creating a TCIA Account
To create a new account, do the following.
- Go to the Legal Framework and Ethical Use of This Resource page to accept the terms.
- Read all of the content on the page and then click the CLICKING HERE link at the bottom.

The New User Registration page appears.
- Complete the form and click Create.
For username and password help, go to TCIA Account Help.
Sometimes, if you emailed the helpdesk before you create your TCIA account, you won’t be able to create a new TCIA account using that same email on your own. Often the solution is to use the “forgot password” link and then you can proceed.
If that does not work, contact help@cancerimagingarchive.net with the subject line Account Creation - email taken.
Performing a Simple Search
A simple search allows you to search for image studies based on a combination of the following search filters: Collections, Image Modality, Anatomical Site, Species, Phantoms, Third-Party Analysis Results, Date released on TCIA, and Subject IDs. The more criteria you select, the fewer results you receive.
To perform a simple search
- On the TCIA home page, click the Simple Search tab.
The Simple Search page appears.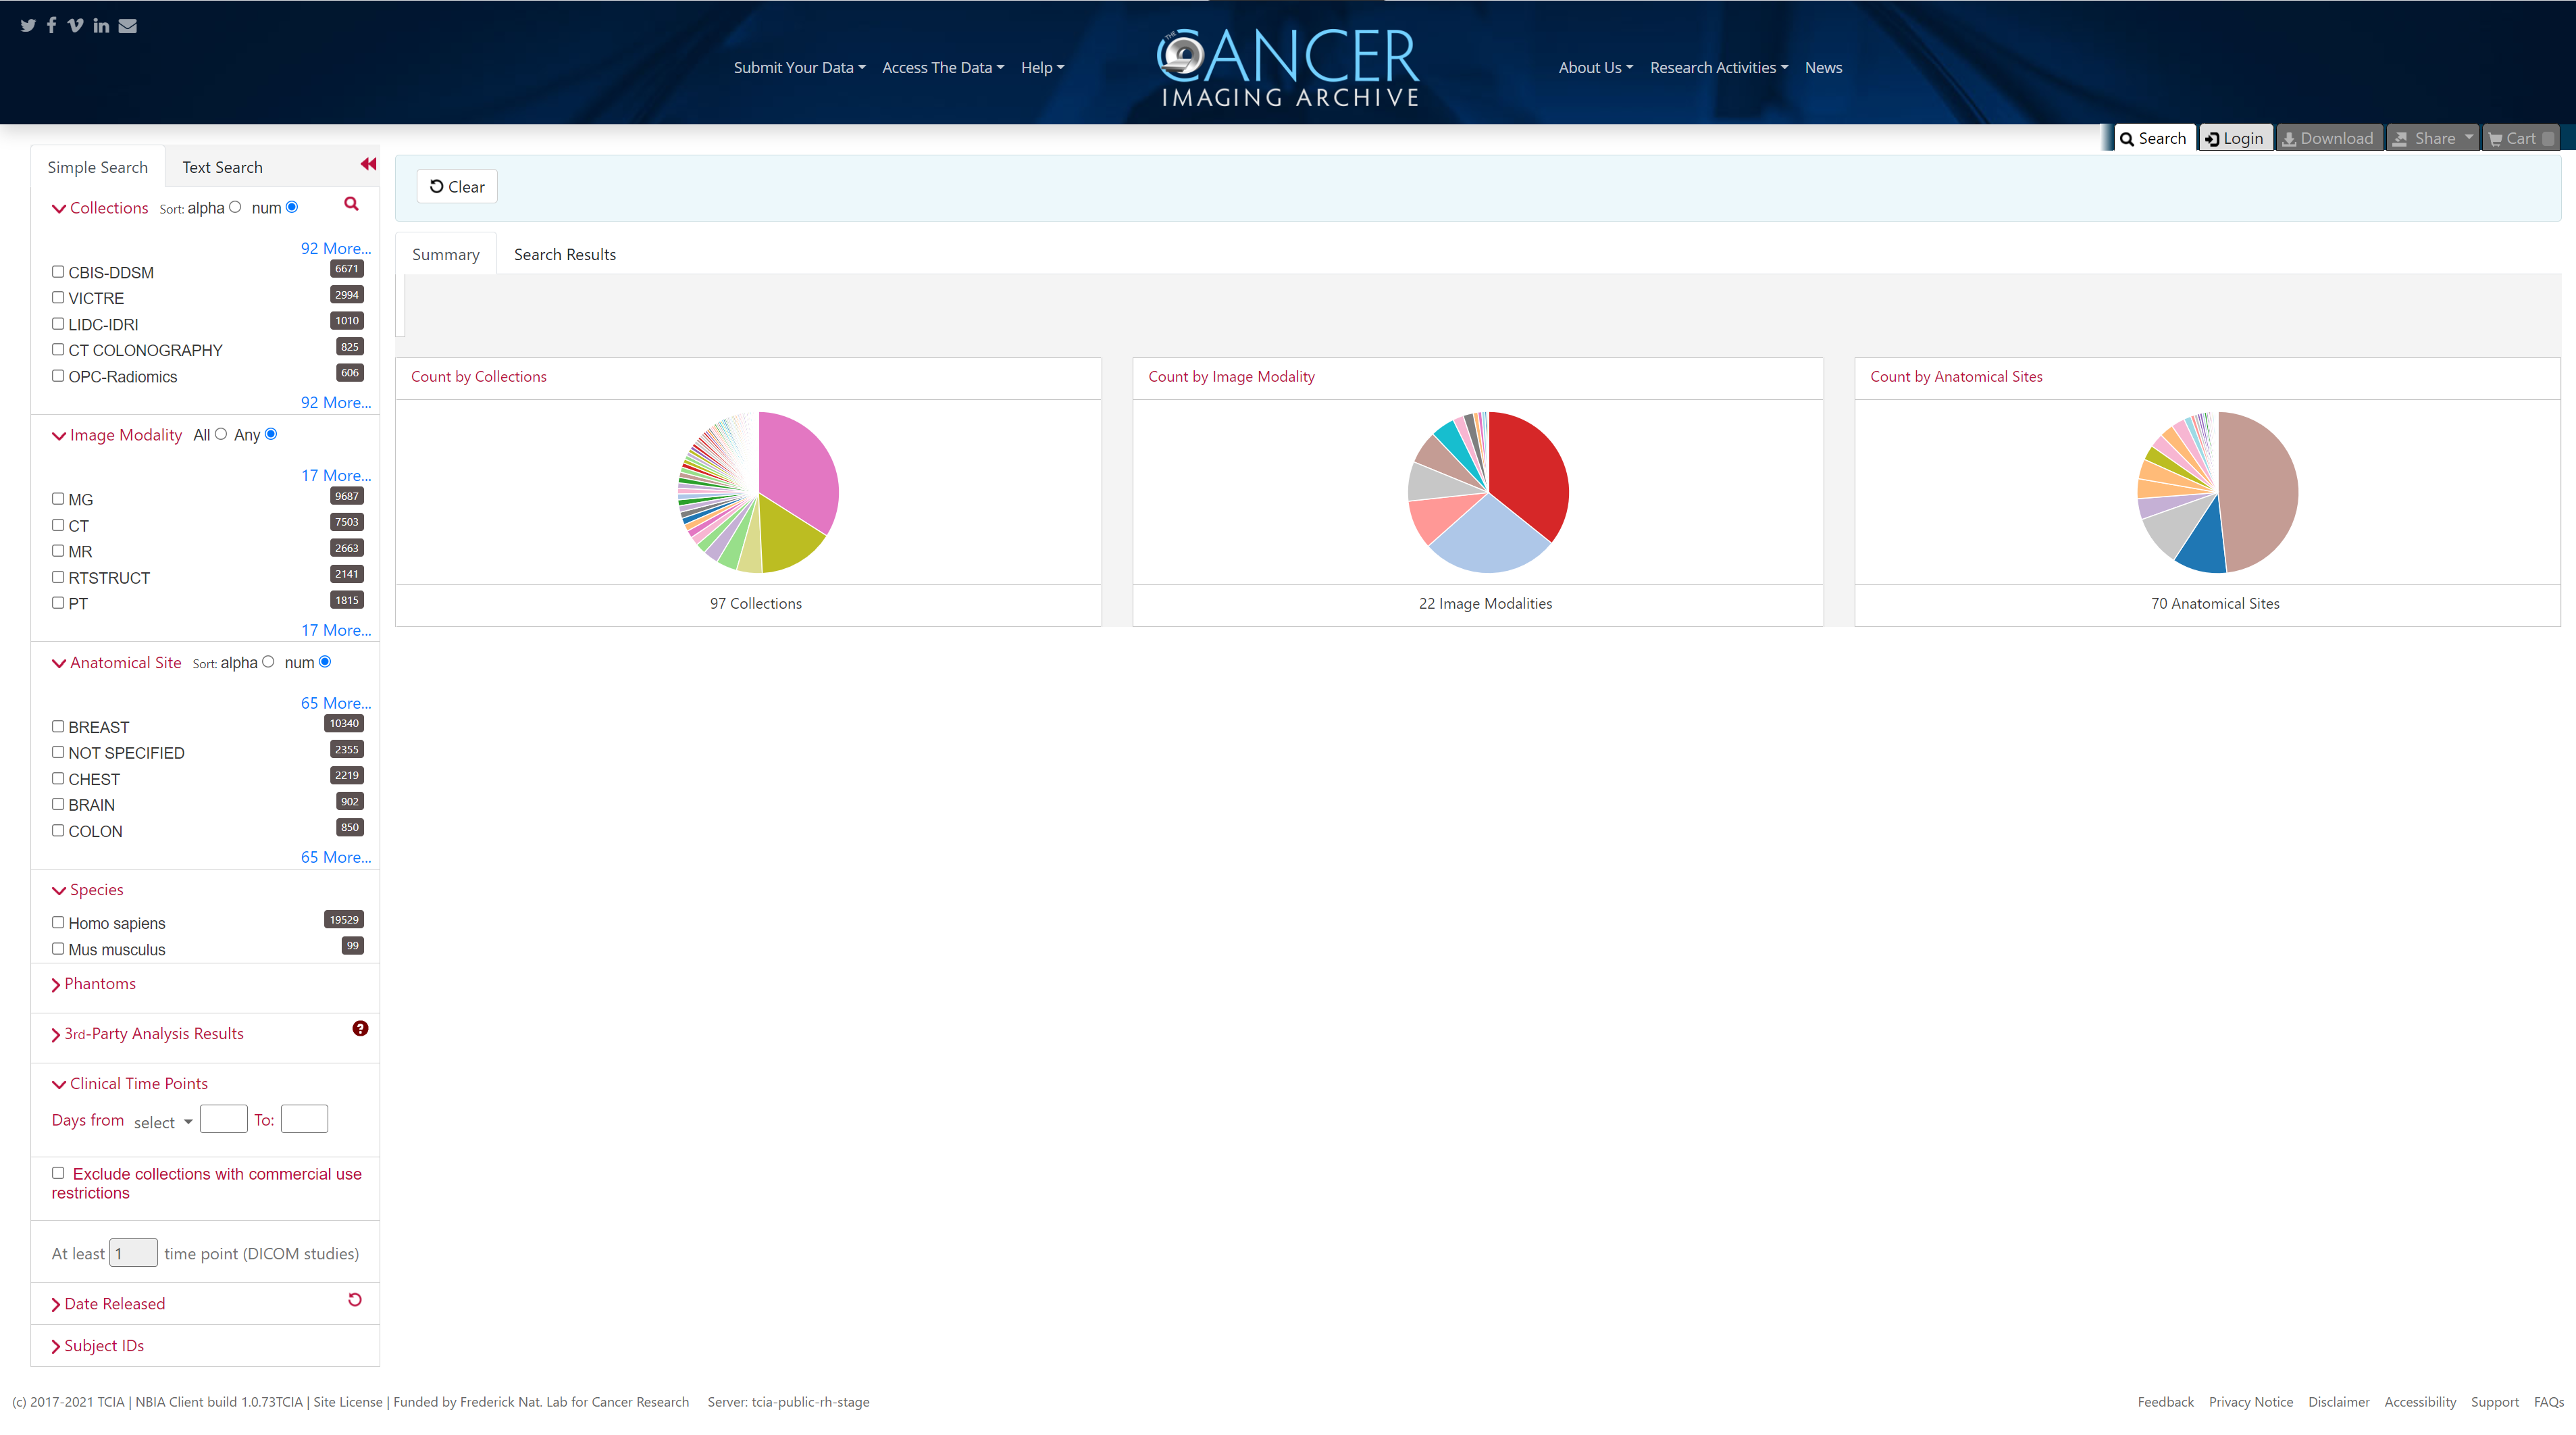
Select filters to narrow down the available image series.
To Select Do This Collections
Option 1: Click the box next to each collection name you want to select.
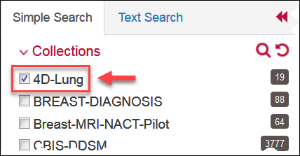
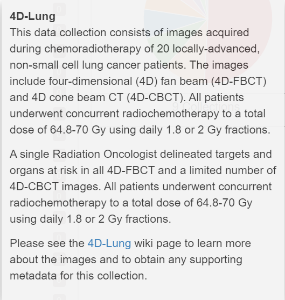
Hovering over a collection name opens a window with information about the collection in it. Quickly move your mouse to this window, where you can select text and click links. The window stays open until you move your mouse away from it.
Option 2: Click the magnifying glass to enter a name.
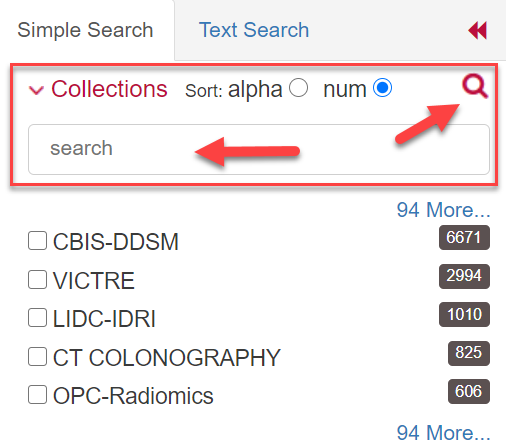
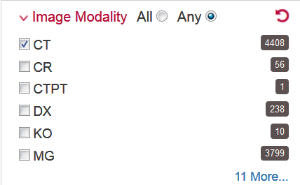
Image Modality
Click the box next to one or more image modalities.
If you select more than one image modality, clicking ANY returns any study that is associated with any of the modalities you selected. Clicking ALL returns all studies that are associated with all of the modalities you selected.
When you select the ANY search modifier here, only the studies that match your search criteria are returned. Be aware that these may be only be a subset of the studies belonging to a single subject (patient). The potential difference between total studies available and the number of studies returned by your search becomes clearer when you select the Total Studies and Total Series columns to appear in your search results. To do so, click
 at the top of the Search Results tab. Select Total Studies and Total Series in the Pick Columns list.
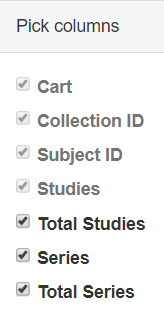
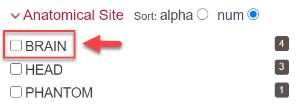
Anatomical Site
Click the box next to each anatomical site you want to select. Click alpha or num to sort the list alphabetically or numerically. Select Not Specified to find data for which the BodyPartExamined field is empty.
Species
Click the box next to the species you want your search results to represent, either human or Mus musculus (mouse).

Phantoms
Click the box next to the phantom option you want to select.

3rd-Party Analysis Results
Third-party analysis results are derived data (e.g. segmentations) that were contributed by researchers who were not part of the group that originally submitted a collection to TCIA. To enhance the value of TCIA collections, TCIA encourages the research community to publish their analyses of existing TCIA image collections. Examples of this kind of data includes radiologist or pathologist annotations, image classifications, segmentations, radiomics features, or derived/reprocessed images.
Click the box next to each third-party analysis results option you want to select. Only DICOM data from third-party analysis results appear when using this search filter. A full listing of all third-party analysis data inclusive of non-DICOM formats appears in the Analysis Results Directory.

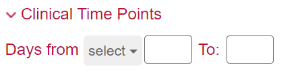
Clinical Time Points
Some datasets encode Clinical Time Point information in the image metadata. This filter allows you to refine search results based on how many days have passed since a particular clinical event occurred when these metadata are included by the data submitter (e.g. "Days since diagnosis"). Click select to view the types that are available in the database, plus their available date range. In the from and to boxes, enter numbers that correspond to the range of days from and to that time point.
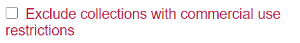
Exclude collections with commercial use restrictions
TCIA supports collections with different types of licenses. Some licenses prohibit the commercial use of the collection. You can filter your search results to exclude those collections that have commercial use restrictions.
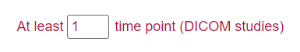
At least X time point (DICOM studies) Enter the minimum number of time points that match the criteria of your search. This filter allows you to see subjects that have more than one DICOM study (that is, the patient was seen at multiple time points).
Date Released
Enter a From and To date to narrow your search results to studies that TCIA first made available during that date range.
Alternately, select the Apply "Available" date range box to exclude studies that were unavailable to TCIA during the selected date range. Click the
 button to return the dates to the default date range.
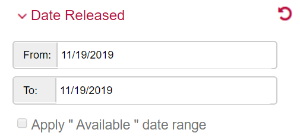
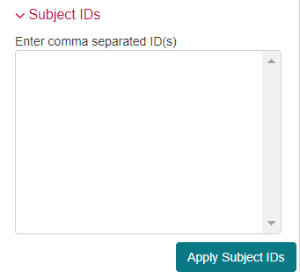
Subject IDs Enter Subject IDs associated with the image series you want to receive in your search results. Separate each Subject ID with a comma and then click Apply Subject IDs.
Select which columns you want to have appear in the detailed search results on the Search Results tab by clicking
at the top of the Search Results tab. The Pick Columns panel appears.
Search results are shown in two different ways, as a summary and as detailed search results, and which one appears first matches your last choice. The Summary tab shows updated pie charts and the number of image series in the search results.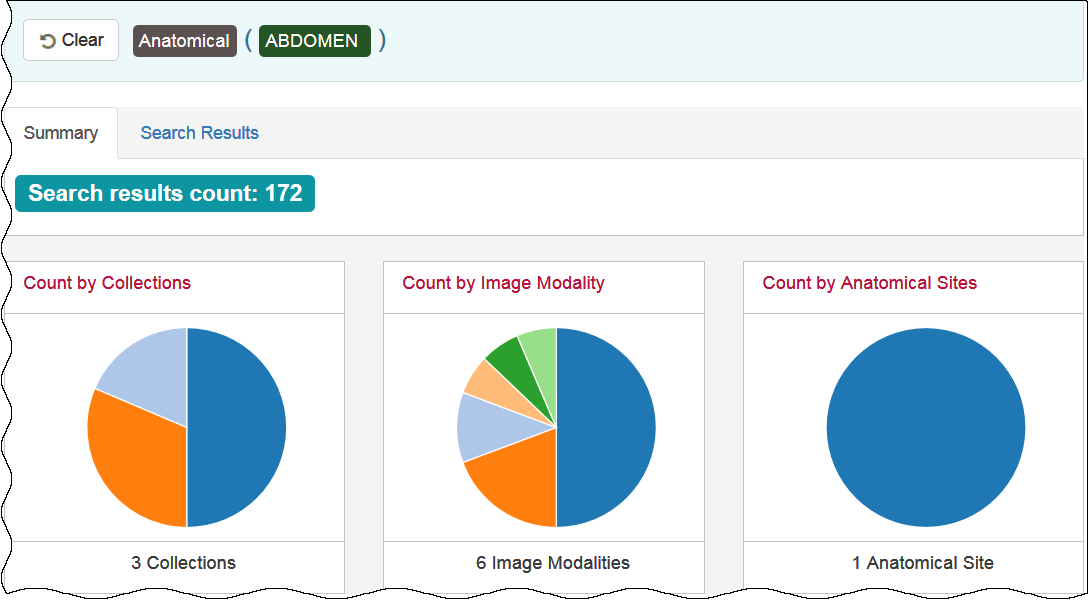
Click the Search Results tab for more detailed results.
Performing a Text Search
A text search allows you to query many of the database fields, DICOM image tag data and their values, and annotation files that are not available in the Simple search. You can also use the text search to query for content of DICOM Structured Reports (DICOM SR) and strains from mouse and rat collections. Refer to the DICOM Data Dictionary for tags or field names you can use in a text search and Structure of DICOM SR Documents for a description of the fields in a DICOM SR.
DICOM Examples
- Enter pancreas in the Text Search box and find all subjects associated with the value pancreas.
- Query using the attribute:searchTerm technique: for example, Body Part Examined:pancreas. In this example, the colon interprets the DICOM field from the value.
- Query by DICOM codes, such as 0018,0015:pancreas. 0018,0015 is the DICOM code for Body Part Examined.
- Query by DICOM SR attributes, such as 0008,0104 for Code Meaning. Entering 0008,0104:tonsil, returns all subjects with a Code Meaning that includes the word "tonsil," and 0008,0104:tonsil adenoid returns all subjects with a Code Meaning that includes both "tonsil" and "adenoid."
- Use a wildcard search such as Body Part Examined:panc* to find all subjects associated with values beginning with panc, including pancreas, pancreatic duct, and pancreatic duct and bile duct systems.
Examples for Strains
- Query for the strain name or parts of the strain name or use a value name pair to construct the query. You can query by the Mouse Genome Informatics (MGI) number or query for MGI in the coding scheme designator field. Examples follow.
- Strain Description (0010,0212) = "NOD.Cg-Prkdc<scid> Il2rg<tm1Wjl>/SzJ"
- Strain Nomenclature (0010,0213) = "MGI_2013"
- Strain Code Sequence (0010,0219):
- Code Value (0008,0100) = "3577020"
- Coding Scheme Designator (0008,0102) = "MGI"
- Code Meaning I0008,0103) = "NOD.Cg-Prkdc<scid> Il2rg<tm1Wjl>/SzJ"
The text search does have some restrictions. These are:
- The text string you use must have more than one character. The search won't return any values if the text string has only one character.
- Do not use a forward slash (/) in your text string.
- Do not use complex searches with AND or OR statements (text search supports Lucene syntax but only a single field can be searched at a time).
To perform a text search
On the TCIA home page, click Text Search or Search Images > Text Search.
The Text Search page appears.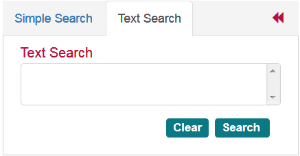
- In the Text Search box, enter a text string of two characters or more.
Click
 .
.
The search results appear.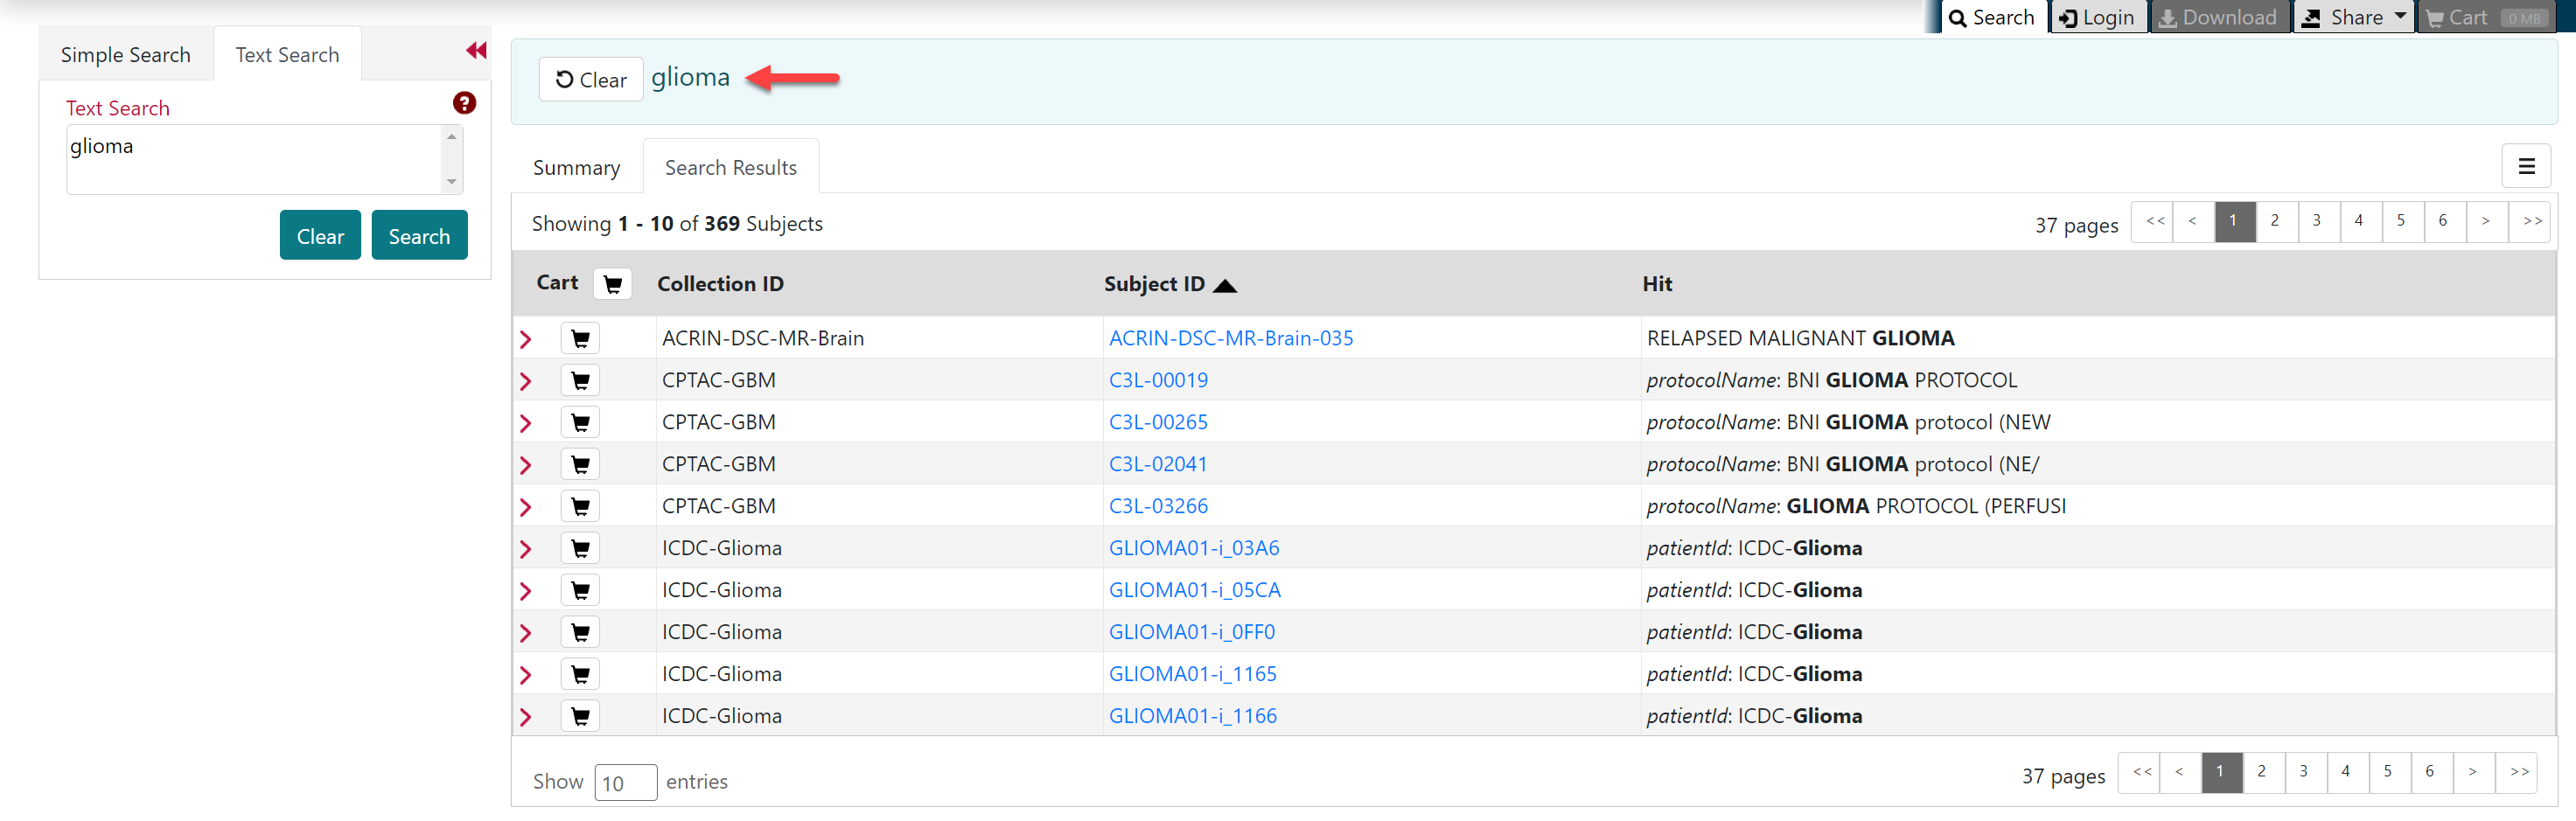
Navigation Tips
- Click the down arrow next to the Subject ID column header to sort the results alphabetically (A to Z or Z to A) by Subject ID.
- Click the arrows at the bottom of the table to display the first, previous, next, or last page of results.
- Click the page number links to move to a specific page of results.
- In the Show (10) entries box in the bottom left, edit the default 10 to the number of entries you want to see on a search results page.
The following table describes each item in the search results table.
Search Result Description 
Click the caret to view the subject details. Click the cart symbol to add image series to your cart. Collection ID Collection identifier Subject ID Click the Subject ID to view all study images for this subject in a DICOM web viewer, a single series' thumbnails, or the DICOM header for the first image in the series. See Search Results (Studies for Subject).
Hit The field in the study where the text string you entered as your search criteria appears.
Viewing Subject Details
The search results from your query are presented both on the Summary tab in pie charts and on the Search Results tab in a table. Each record in the table corresponds to one subject (patient) and displays the collection(s), study(ies), and image series associated with that subject.
From the Search Results tab, you can view subject details, view all image series associated with the subject, and add image series to your cart for download. You can also view the DICOM header for a selected image series. In the future, you will be able to view the image.
To view subject details
- Search for studies that match criteria that interest you.
The Summary tab refreshes to show your search results in pie chart form. Click the Search Results tab.
The search results that match your criteria appear sorted by Subject ID.You can add all studies associated with a subject to your cart at the same time or drill down to an individual study and add it to your cart instead.
Click a Subject ID link.
All studies associated with this subject appear. In this example, this subject is only associated with one study, and only one image series is associated with that study.The red asterisk indicates that the date, which is the date that this series was first available at TCIA, has been offset to protect private health information.
- Click the date or the arrow to the left of the study cart icon to view details about the selected study.
All of the image series associated with that study appear.
You can now
- Add an image series to your cart.
- View the series description, modality, manufacturer, number of images, and series ID.
- View thumbnails of the image series.
- View an animation of the image series.
- View DICOM data for this image series.
Viewing Thumbnails of the Image Series
You can view thumbnails of all images in the selected series and then open selected images for further analysis in another image system.
To view thumbnails
- View the details for a subject.
- Select a study and view its details.
- In the row for an image series, click
 .
.
Thumbnails of all of the images in the selected image series appear.
- Click any image to download it to your computer.
Follow your browser's instructions to open or save the file.
Viewing TCIA Collections
You can visualize TCIA collections before you download them by launching an image animation when there are more than two images in the series.
To view a TCIA collection
- View the details for a subject.
- Click the study date link for the collection you want to view.
The image series associated with this study appear.
- In the row for an image series, click
 .
.
The images in the series open in the Open Health Imaging Foundation (OHIF) Viewer.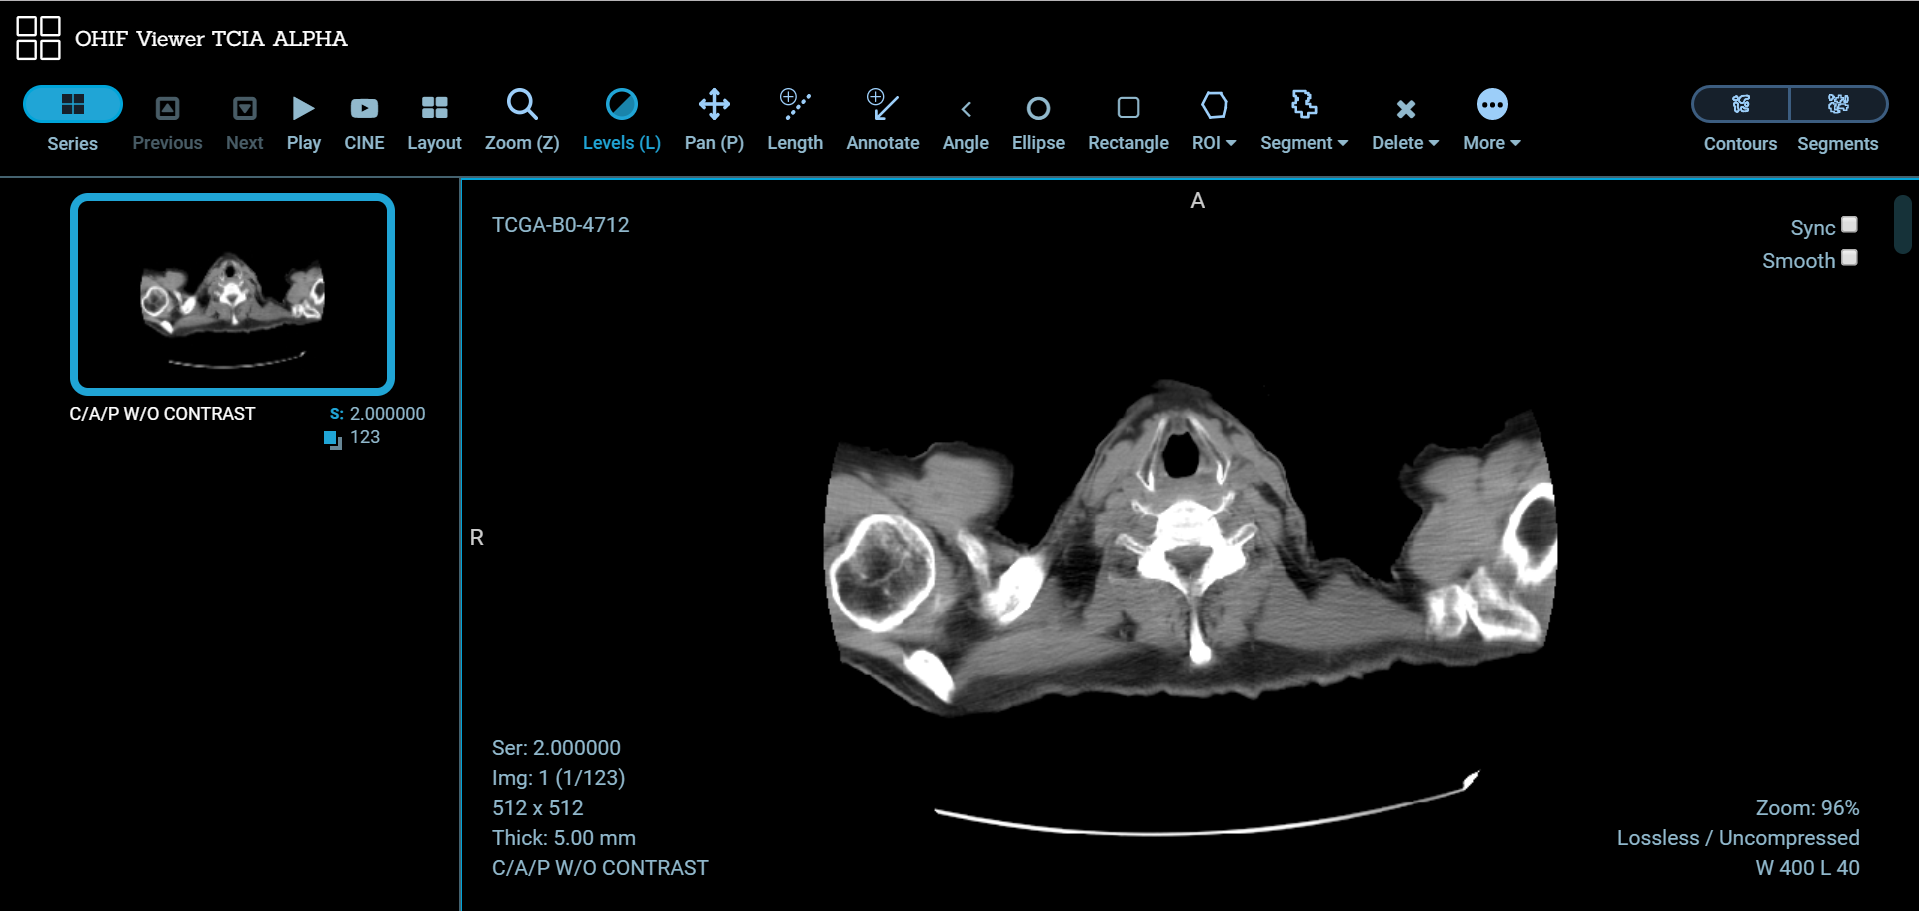
- Click
 to display the images in the series sequentially.
Viewing DICOM Data
Digital Imaging and Communications in Medicine (DICOM) is a standard for handling, storing, printing, and transmitting information in medical imaging.
You can view the DICOM tags that form the header of the selected image series.
To view DICOM data
- View the details for a subject.
- Select a study and view its details.
- In the row for an image series, click
 .
.
The DICOM tags associated with the image series appear.
Downloading Study Data
You can download items you add during the current work session. Before you download items you must download and then install the NBIA Data Retriever.
You select items to download by first searching for them in NBIA and then adding them to your cart.
You can also export data in your cart to a spreadsheet.
Adding Data to the Cart
To remove all of the data associated with this subject from the cart, click the cart icon again.

To add all image series associated with a study to the cart
- Search for the subject.
- Click the Search Results tab.
- Click a Subject ID link.
All of the studies associated with this subject appear. Click the cart icon next to one or more studies.
All of the image series in the selected studies are added to the cart.
The cart icon in the study row turns green. If you did not select all of the studies associated with the subject, the cart icon in the subject row turns yellow.
The cart itself, in the upper-right of the window, shows how many image series are in it and how large the download will be.
To remove all of the data associated with this subject from the cart, click the cart icon again.

To add one or more image series to the cart
- Search for the subject.
- Click the Search Results tab.
- Click a Subject ID link to open all series associated with that subject.
- Click the cart icon for one or more series.
The cart icon you select turns green.
The cart icon for the subject turns yellow, indicating that you have not selected all available series for this subject.
The following topics are in this section:
Exporting Data to a Spreadsheet
Once data is in your cart, you can export it to a Comma-Delimited Values (CSV)-format spreadsheet for analysis or sharing with others.
To export your cart
- Add data to your cart.
- Click
 .
.
The cart appears.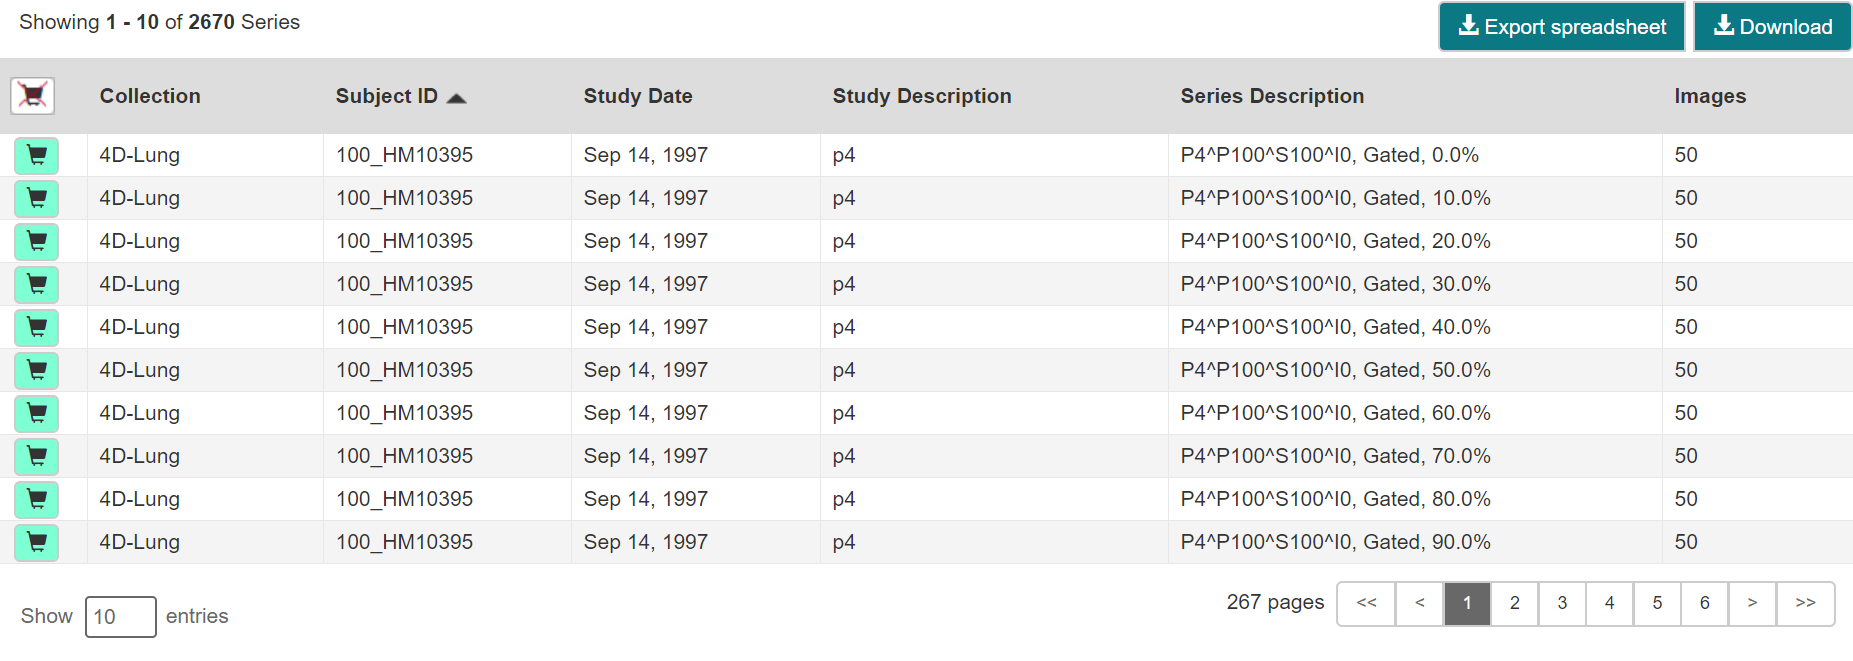
- Click
 .
.
A CSV file called "metadata" opens in your browser. This file provides an overview of the downloaded files.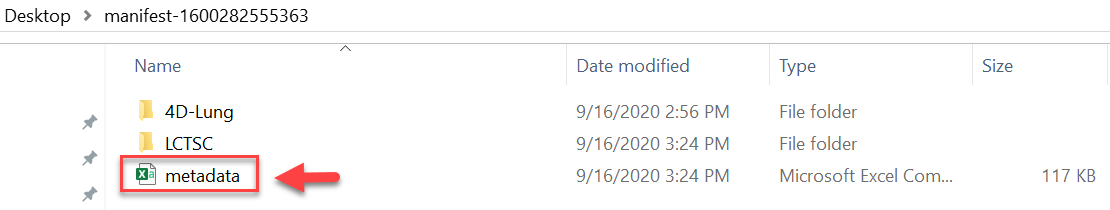
Metadata file in the manifest folder
This file includes the following columns:- Series Instance UID
- Collection
- 3rd Party Analysis
- Data Description URI
- Subject ID
- Study UID
- Study Description
- Study Date
- Series Description
- Modality
- Manufacturer
- SOP Class Name
- SOP Class UID
- Number of Images
- File size
- File Location
- Download Time Stamp
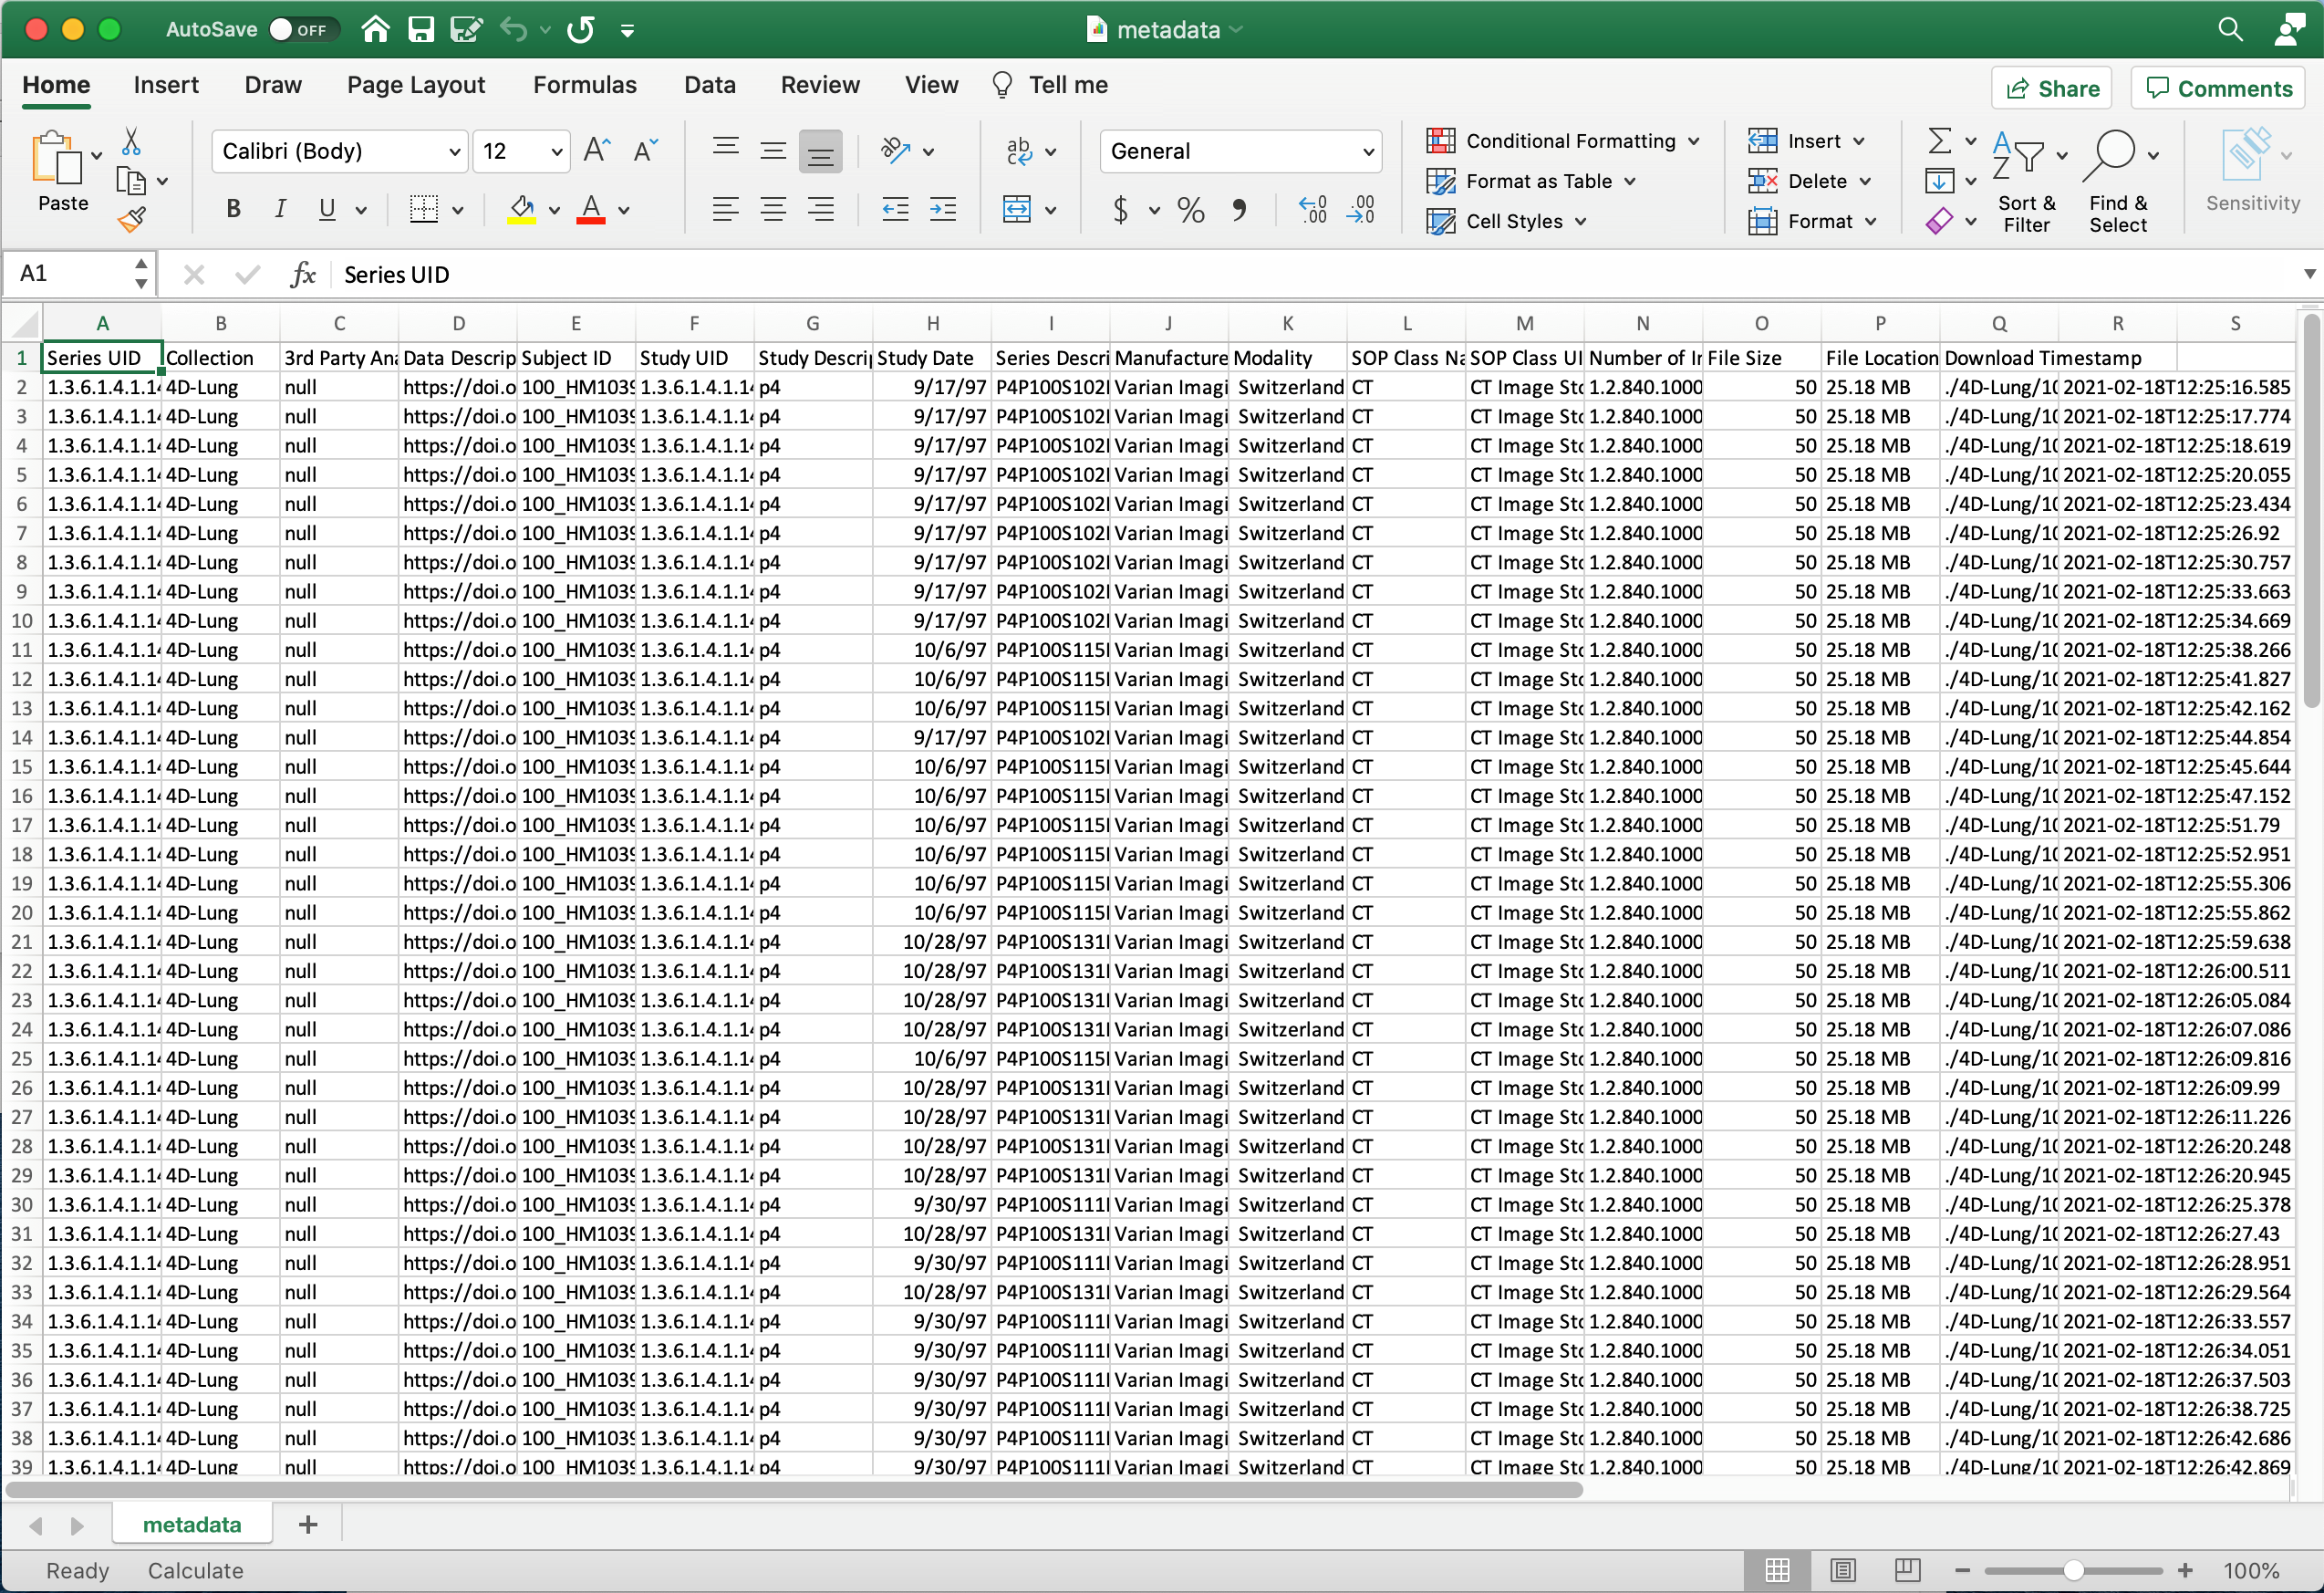
Metadata file opened in Microsoft Excel
Sharing a Query
You can save your query for later use or share it with a colleague by email.
To share a query
- In the top menu bar, click
 and then select Share my query.
The Query URL box appears.
- Click Copy URL.
The URL copies into your Clipboard. Paste the URL into an email or a document.
Shared queries honor data permissions that may exist. Each person that runs the shared query will only see search results that he or she is allowed to see.
Sharing Data in Your Cart
Once you have added data to your cart, you can share it as a URL to a static set of data. When you or a colleague opens the URL in a browser window, NBIA opens to the cart page.
In the legacy NBIA data portal, this was called a shared list.
To share data in your cart
- Add data to your cart.
- In the top menu bar, click and then select Share My Cart.
The Retrieve Cart Data URL box appears.
- Click Copy URL.
The URL copies into your Clipboard. - Paste the URL into an email or a document.
The shared cart honors data permissions that may exist. Each person that opens the shared cart will only see data that that person is allowed to see.