Problem: How To Add Data to an Existing Study
Topic: caIntegrator Usage
Date entered: 08/25/2011
Release: Up to caIntegrator 1.3
Solution
This guide shows how to add clinical annotation and genomic microarray data to an existing study in caIntegrator, with a focus on common obstacles and pitfalls that may arise in the process. It assumes that you already have basic familiarity with the program and have created a study containing at least one source for both annotation and array data. It also assumes that you have additional sources available, namely:
- Your clinical annotations in the form of a comma delimited text (CSV) file containing at least one field with unique IDs for each subject
- The host name of the caArray server where your data is stored, plus the experiment ID (if you set the data as private, you will also need the user name and password for accessing the data)
- Another two CSV files – a 'mapping file' that maps the subject IDs in your annotations to their corresponding sample IDs in caArray, and a 'control training file' that lists the sample IDs of all control subjects
The guide is presented in a step-by-step instructional format, with each step accompanied by a screenshot from caIntegrator.
Getting Started
- Log into caIntegrator via the application's main Web page.
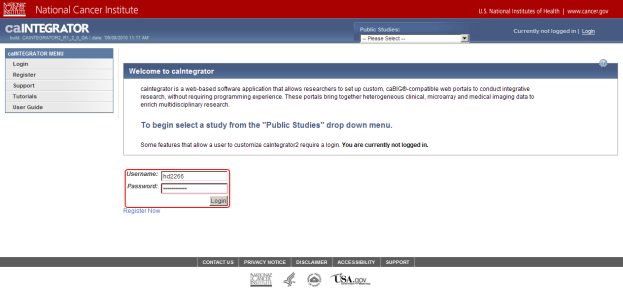
First log into caIntegrator via the application's main Web page. In this example, I've logged in with my username (hd2266).
- Each installation of caIntegrator can host several studies. When you first log in, you will be taken to the home page of the default study, which in this case is entitled 'jagla-00034'. Since this is not the study we want to add data to, you will want to bring up a list of available studies by clicking on the 'Manage Studies' link under the 'STUDY MANAGEMENT' menu in the navigation panel to the left.
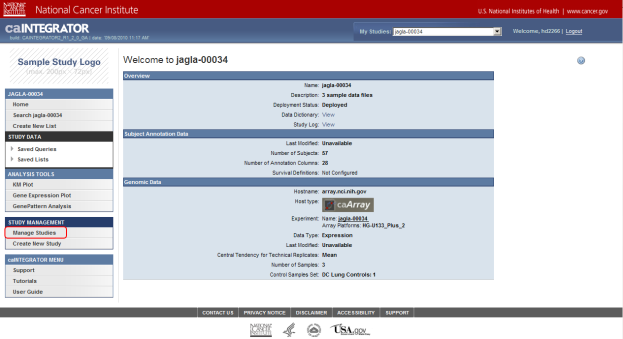
Once you log in, you are taken to the home page of the default study, which in this case is 'jagla-00034'. The study we want to add data to is 'Demo Study for ICR Folks', which you can access by clicking on the 'Manage Studies' link (highlighted in red).
On the Manage Studies page, find the study entitled 'Demo Study for ICR Folks' in the table of studies, then click on the 'Edit' link under the Action column at the far right of the table.
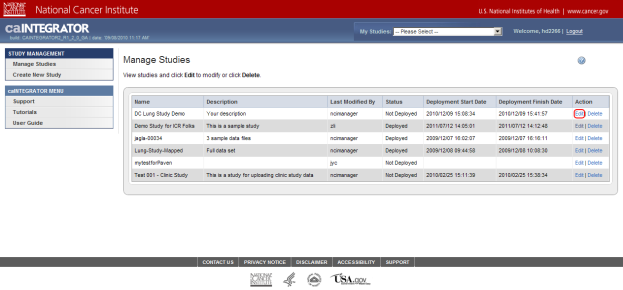
You can edit the study entitled 'Demo Study for ICR Folks', which is at the top of the study list, by clicking on the 'Edit' link (highlighted in red).
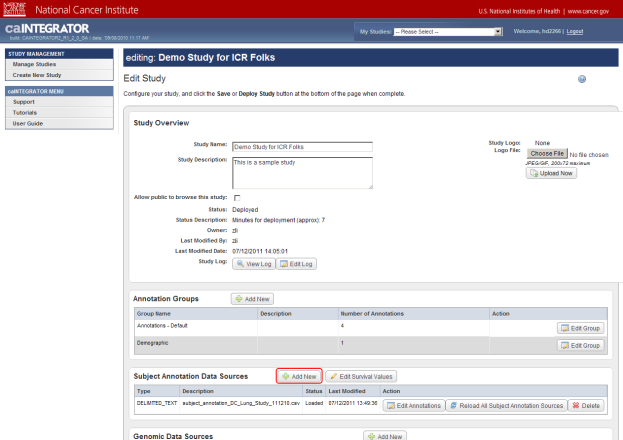
Now you are on the 'Edit Study' page, where you can modify the existing study data or load more data into it. For the purposes of this tutorial, the areas of interest on the Edit Study page are 'Subject Annotation Data Sources' and 'Genomic Data Sources', whose respective headings are highlighted in the screenshot below.
Note that this study already has some subject annotation and genomic data loaded. The annotation data is in the form of the CSV file 'subject_annotation_DC_Lung_Study_111210.CSV', while the genomic data is in the form of a link to the address of the caArray server which hosts the data (array.nci.nih.gov), as well as an experiment identifier (jacob-00182) which references the particular experiment containing the data of interest. Later in this tutorial, we will examine in depth how to load more of this data into the study.
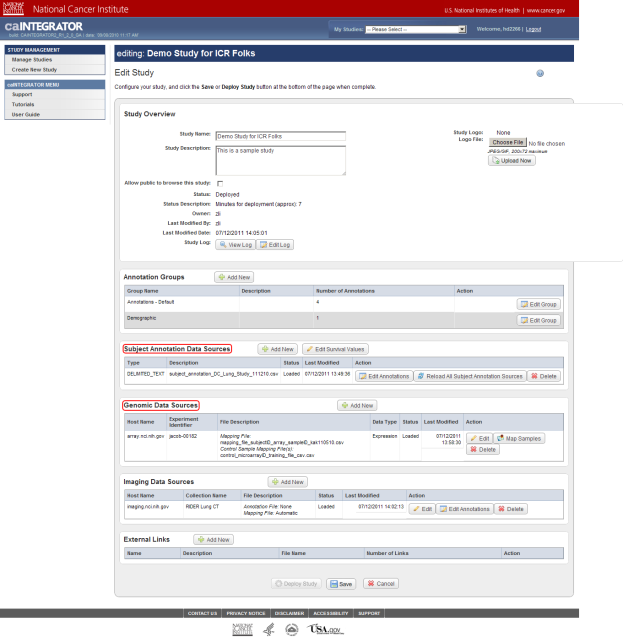
This study already has subject annotation and genomic data loaded; they are listed beneath their respective headings, which are highlighted in red. Later in this tutorial, we'll learn how to load more data into this study.
Loading Additional Clinical Data
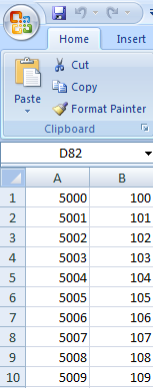
- Now we're ready to load additional subject annotation data into the 'Demo Study for ICR Folks'. As mentioned before, you'll need the data in the form of a CSV file containing at least one field with a unique ID for each subject in the study. The CSV file we'll use in this tutorial is called 'subject_annotations_tutorial.CSV'. A partial screenshot of the file appears below as viewed in a Microsoft Excel 2007 window.
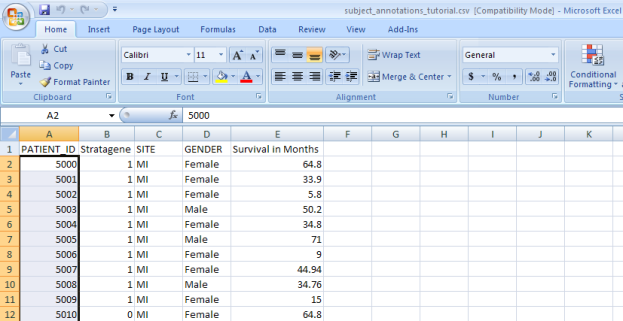
This data came from a fictional multi-site study that compared gene expression between lung adenocarcinoma patients and healthy controls. The nature of the data itself is irrelevant to our purpose here. The relevant aspect is that the data is categorized into five fields, which are represented by columns in the spreadsheet.
Each field defines a different subject characteristic such as 'PATIENT_ID', which uniquely identifies each of the 100 subjects in this study (note that the screenshot above only displays data for the first 11 subjects). Once we've loaded the data into the study, we'll be able to query it by any of the fields.
To upload your data file, first click on the 'Add New' button to the right of the 'Subject Annotation Data Sources' heading.
You can load a new subject annotation data file into the existing study by clicking on the 'Add New' button (highlighted in red).
- When you click on the button, the area below it will expand to display additional options. Click on the 'Choose File' button in the expanded area.
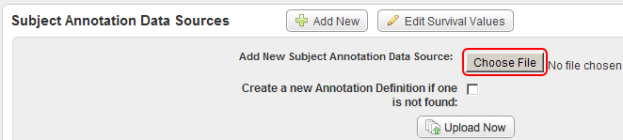
When you click on the 'Add New' button, the area below it will expand. Click on the 'Choose File' button (highlighted in red) in the expanded area.
- When you click on the 'Choose File' button, you'll be prompted for the location of the data file with an Open dialog. Locate the CSV file containing your subject data, click on it, then click on the 'Open' button.
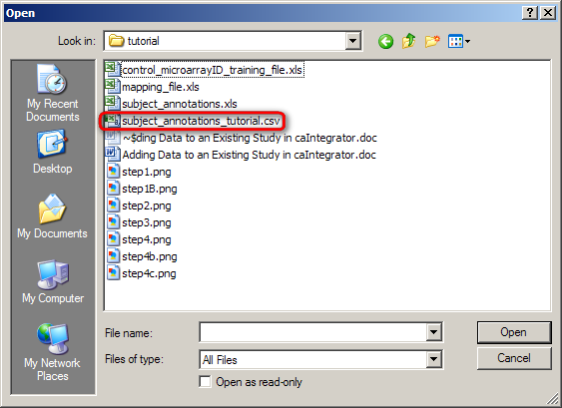
In this example, we click on the 'subject_annotations_tutorial.CSV' file (highlighted in red), then click on the Open button. Your own annotations file will be named differently.
- Once you open your annotations file, you'll be taken back to the Edit Study page, where you can click on the 'Upload Now' button at the bottom of the area to load the file into the study.
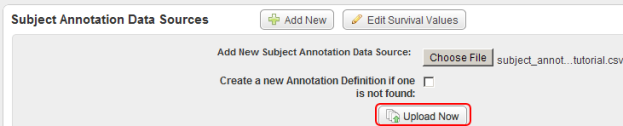
Click on the 'Upload Now' button (highlighted in red) to load the subject data into the study.
- Once you've uploaded the data, you'll encounter another page prompting you to define the various fields for your subject data. Since these fields were already defined when the study was created, we don't need to modify them. Just click on the 'Save' button at the bottom of the page to continue.
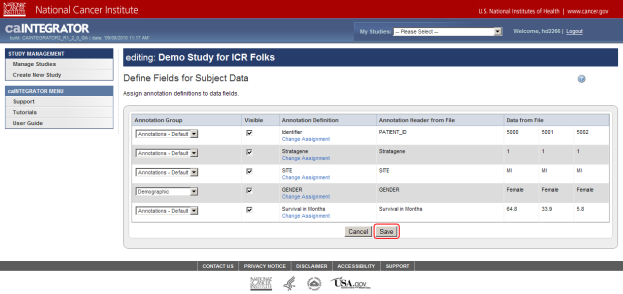
Click on the Save button (highlighted in red) to confirm your annotation field definitions.
- Back on the 'Edit Study' page, the newly uploaded source will now appear in the table beneath the 'Subject Annotation Data Sources' heading. Notice that the status of this source appears as 'Not Loaded' under the Status column. To change this, click on the 'Load Subject Annotation Source' button under the Action column.
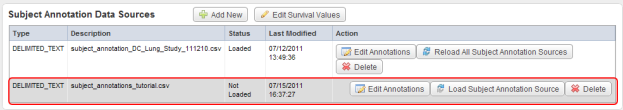
The newly uploaded source now appears in the second row (highlighted in red) of the Data Sources table. Click on the 'Load Subject Annotation Source' button under the Action column to load the source.
The 'Edit Study' page has now reloaded and the status of the newly added source has changed to 'Loaded' under the Status column in the Data Sources table.
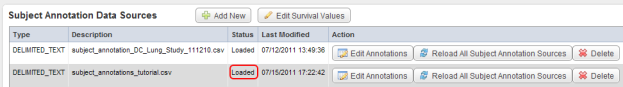
The status of the newly uploaded source now appears as 'Loaded' (highlighted in red) under the Status column.
- To see what obstacles may arise in the course of loading additional data, let's try another file. This one, named 'duplicate_annotations_tutorial.CSV', contains the same five fields as each of the previously loaded files, including 'PATIENT_ID'. After repeating the procedure in steps 3 through 8, the Edit Study page displays an error message stating, "Value already loaded: Subject 3 already has a value for Stratagene" above the 'Annotation Groups' heading; in addition, the status of the newly loaded file shows as 'Error' under the 'Status' column of the 'Subject Annotation Data Sources' table.
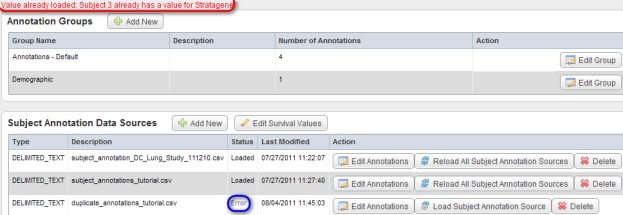
After attempting to load the next annotation file 'duplicate_annotations_tutorial.CSV', the 'Edit Study' page shows the error message "Value already loaded: Subject 3 already has a value for Stratagene" (highlighted in red) and the status of the file shows as 'Error' (highlighted in blue).
To understand why this error is occurring, let's examine the contents of the new annotation file we just tried to load. A partial screenshot of the file appears below as viewed in a Microsoft Excel 2007 window.
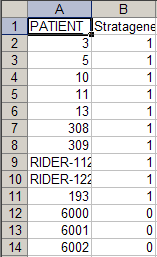
Notice that this file contains not only new subjects (IDs 6000 to 6002), but also some of the same subjects (i.e., IDs 3, 5, and 10) from the previously loaded file "subject_annotation_DC_Lung_Study_111210.csv". In addition, the values in the 'Stratagene' field for these subjects are different in the new file than they were in the original file. This explains the 'Value Already Loaded' error message which occurs when we attempt to load the file – this message is another way of saying that the file we're trying to load contains duplicates of subjects from previously loaded files.
We've learned a valuable lesson from this exercise: when loading additional annotation data into an existing study, make sure that your annotation file doesn't contain any duplicates of existing subjects from previously loaded files.
Querying Clinical Data
- We can't query the study unless it's already been deployed. To check whether this is the case, scroll all the way down to the bottom of the 'Edit Study' page, where you'll see a row of three buttons. If the study has been deployed, as is the case in our example, the left button labeled 'Deploy Study' will be grayed out and you will not be able to click on it. If, however, the study hasn't been deployed, the button will appear normally, and you can click on it to deploy the study.
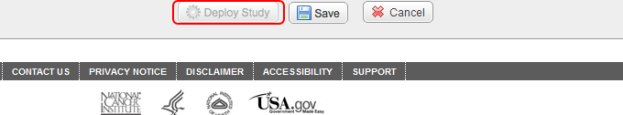
The bottom of the 'Edit Study' page shows the 'Deploy Study' button (highlighted in red). In this example, the study has already been deployed so this button is grayed out. If your study hasn't yet been deployed, the button will appear normally, and you can click on it to deploy the study.
- Now that we've loaded our clinical data into the study, let's query it. To get started, click on the link 'Search Demo Study for ICR Folks' under the menu 'DEMO STUDY FOR ICR FOLKS' in the navigation panel to the left.
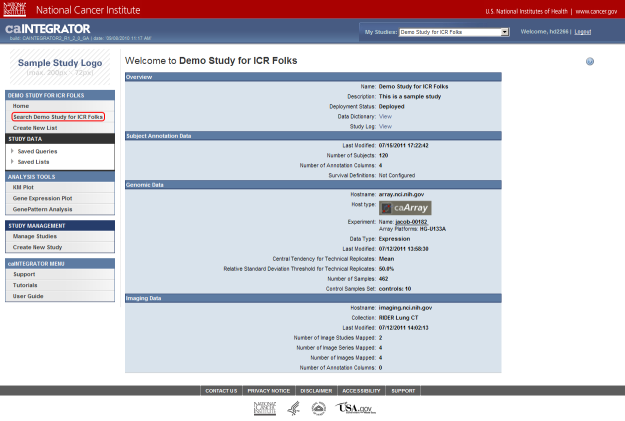
Click on the link 'Search Demo Study for ICR Folks' (highlighted in red) to perform a query on the annotation data you just uploaded.
- On the 'Search' page, under the Criteria tab, we can define multiple criteria to query the study by. These criteria correspond to the various fields we previously defined in our annotation data. To review, those fields are 'Patient ID', 'Stratagene', 'Site', 'Gender', and 'Survival (in months)'.
As an example, let's say we want to query the data for all male subjects located at the 'MI' study site. In this case, our two query criteria are 'Site' and 'Gender', and their respective query values are 'MI' and 'Male'. We can formulate the query by first clicking on the 'Add' button to the right of the drop-down list under the 'Define Query Criteria' heading.
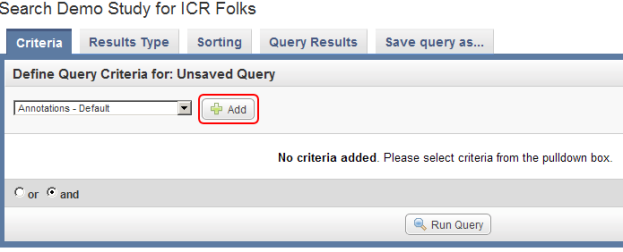
To begin formulating your query, click on the 'Add' button (highlighted in red).
- Next, click on the drop-down list that appears below the 'Add' button. The list contains three items: 'Site', 'Stratagene', and 'Survival in Months'. Click on 'Site'.
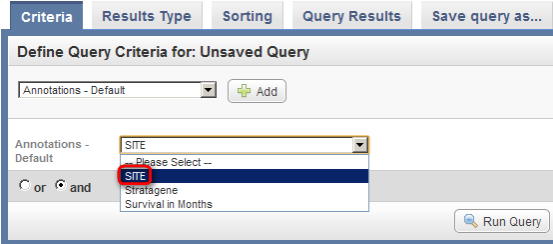
Click on 'Site' (highlighted in red) from the Annotations drop-down list to select it as a query criterion.
- Once you click on 'Site', another two drop-down lists will appear to the right of the original one. Click on the third (rightmost) list to bring up the different values for Site and click on 'MI' from this list.
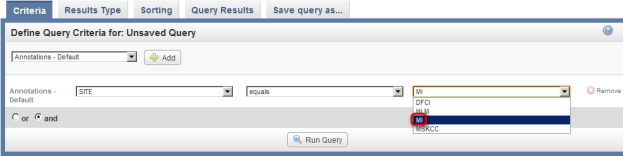
Click on 'MI' (highlighted in red) in the drop-down list of values for the Site field.
- We also want to query by Gender. Due to the way that the study was originally set up, the Gender field isn't included in the default set of annotations – it's part of a separately defined set called 'Demographic'.
To add Gender as a field, go back to the original drop-down list (the one at the top), click on it again, click on 'Demographic' in the list, and then click on the 'Add' button to the right of the list.
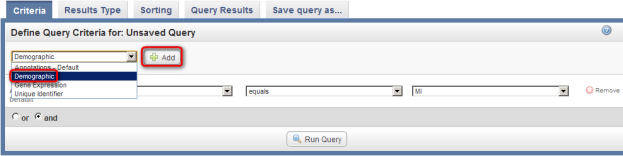
Select Demographic (highlighted in red) from the drop-down list, then click on the Add button (also highlighted in red).
- Next, a new drop-down list labeled 'Demographic' will appear below the one labeled 'Annotations – Default'. Click on this new list, then click on 'GENDER'.
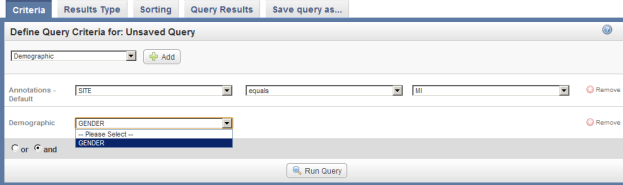
Click on 'GENDER' in the 'Demographic' drop-down list.
- Once you click on 'Gender', another two drop-down lists will appear to the right of the original one. Click on the third (rightmost) list to bring up the different values for Gender and click on 'Male' from this list.
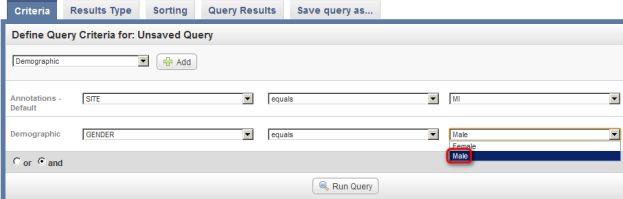
Click on 'Male' (highlighted in red) in the third (rightmost) drop-down list labeled 'Demographic'.
- Now that we've fully defined our query, we're ready to run it. Click on the 'Run Query' button at the bottom of the page to see the results.
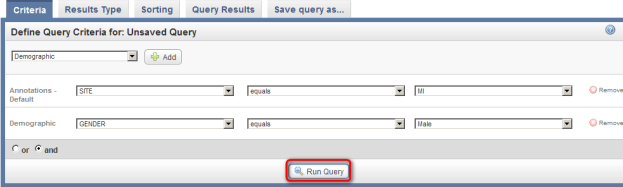
Click on the 'Run Query' button (highlighted in red) to see results.
- The query results appear under the 'Query Results' tab as a table of subject IDs that fit the specified criteria – in other words, male subjects who were located at the MI site. Note that these results include subjects not only from the annotations that we uploaded in this tutorial, but also from the pre-existing ones. You can confirm this by noting that some of the subject IDs in the results screenshot below (i.e., 709, 706) fall outside the range of IDs from the annotation file we just uploaded (i.e., 5000 to 5099).
You can sort these results in numerical order of subject ID by clicking on the 'Subject ID' heading above the right table column.
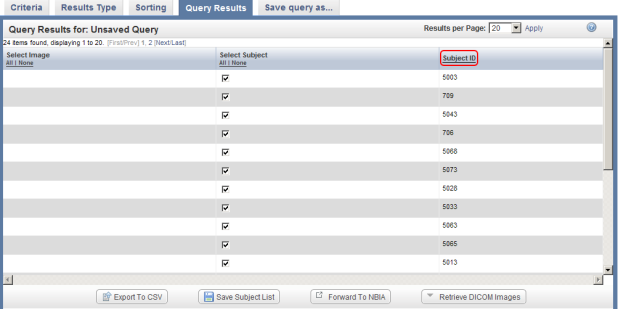
You can sort query results by clicking on the Subject ID heading (highlighted in red) above the right column.
- You can customize the display of query results by clicking on the 'Results Type' tab at the top of the page and selecting additional fields to be displayed via the checklists for each annotation set. In this example, we checked off 'Stratagene' and 'Survival in Months' in the default annotation checklist.
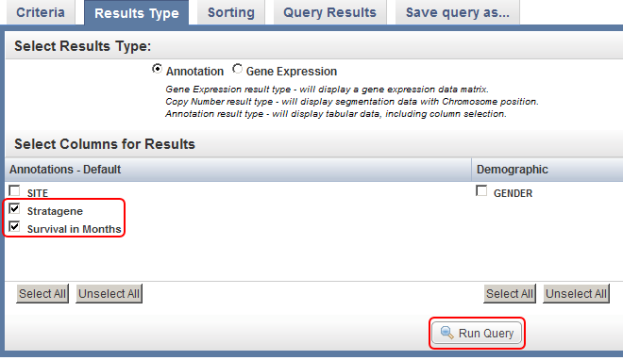
You can select additional fields (highlighted in red) to be displayed in the query results by selecting them from the checklists in the 'Results Type' tab, then clicking on the 'Run Query' button (also highlighted in red).
If you now click on the 'Run Query' button at the bottom right of the page, the results will be displayed again under the 'Query Results' tab, but this time with the additional columns Stratagene and Survival in Months, which correspond to the new fields we selected.
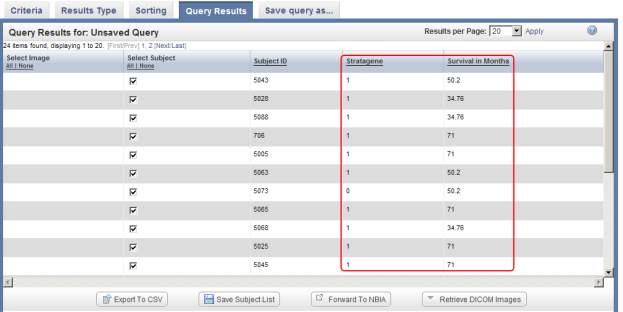
The updated query results include two additional columns (highlighted in red) which correspond to the two additional fields we selected under the 'Results Type' tab.
- To save this query in caIntegrator for future reference, click on the 'Save query as..' tab at the top of the page, enter a name and description for the query in the respective fields, and click on the 'Save Query' button at the bottom.
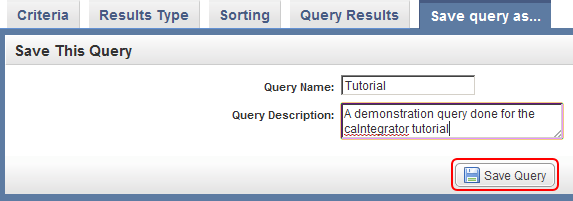
You can save the query by clicking on the 'Save query as..' tab, entering a query name and description, and clicking on the 'Save Query' button (highlighted in red).
- Once the query is saved, the Search page will reload and the Study Data menu in the left navigation panel will expand to show the newly saved query 'Tutorial' under the 'My Queries' heading. You can click on the magnifying glass icon to the left of the Tutorial link to bring up the query results again, or on the pencil icon to edit the query criteria.
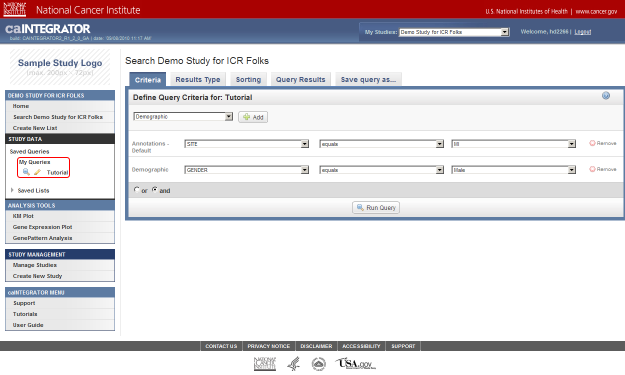
The 'Tutorial' query (highlighted in red) is now saved under the 'STUDY DATA' menu in the left navigation panel and can be accessed at any time.
Loading Another Genomic Dataset
Now that you've uploaded your clinical data and learned how to query it, you're ready to do the same with your array and mapping data. To review, you'll need the server host name for your caArray data, the experiment ID, and your mapping and control training CSV files.
- To begin, navigate back to the 'Edit study' page for the 'Demo Study for ICR Folks'. If you forgot how to do this, you can refer to step 2 in this tutorial.
- On the 'Edit study' page, scroll down to the 'Genomic Data Sources' heading. The table below it shows that one source has already been loaded and mapped. To add another, start by clicking the 'Add New' button to the right of the heading.
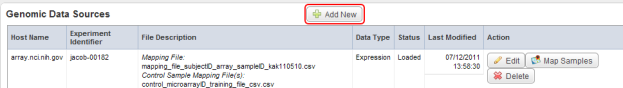
Click on the 'Add New' button (highlighted in red) to begin adding a new genomic data source.
- On the 'Edit Genomic Data Source' page, most fields are pre-populated with default values. These include the server hostname, which is set to array.nci.nih.gov. As it happens, this is the server where our example array data is stored.
Every data source in caArray has a unique experiment ID that distinguishes it from the other sources. You can enter the ID for your experiment in the 'caArray Experiment Id' field, which is about halfway down the page. If you don't enter the ID for your source, then caIntegrator won't be able to retrieve your data, and will display an error message to that effect. In our example, the experiment ID is 'jacob-00182', which we enter in the field.
If your server hostname or any of the other values for your data source differ from the default values, then enter them into their respective fields, then click on the 'Save' button at the bottom of the page. (Remember that, if your study is private, you must enter the login credentials into the 'Username' and 'Password' fields.)
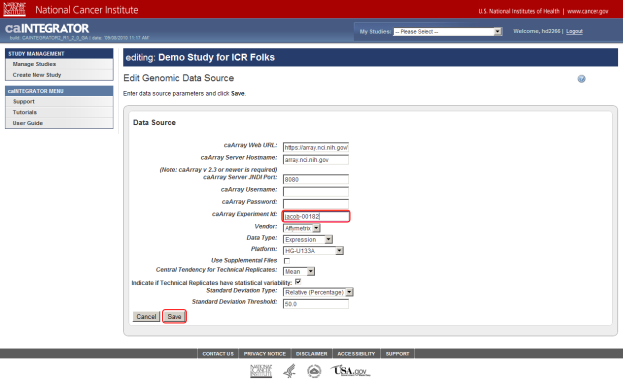
Enter the values for your data source if they differ from the default values, then click on the 'Save' button (highlighted in red). Don't forget to enter your caArray experiment ID – the ID for our example source is 'jacob-00182'.
- Back on the 'Edit Study' page, a new row has appeared in the 'Genomic Data Sources' table which corresponds to the new data source we just added. Our next step is to map the samples in this source to the subjects in our annotation source. To begin, click on the 'Map Samples' button under the 'Action' column at the right of the table.
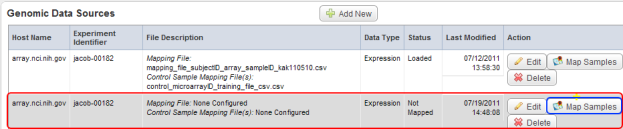
The newly added row (highlighted in red) in the Genomic Data Sources table corresponds to the new genomic data source we added in step 24. Click on the 'Map Samples' button (highlighted in blue) to map the samples to subjects from the annotation source we added in steps 3 to 8.
- The 'Edit Sample Mappings' page displays a list of unmapped samples, followed by another list mapping sample IDs to subject IDs. As you can see, the mapping list is empty, which means that none of the samples in this source have been mapped yet! The list of unmapped samples appears under the heading 'Unmapped Samples' and subheading 'Sample Name'. The numbers in this list represent the sample IDs of the unmapped samples.
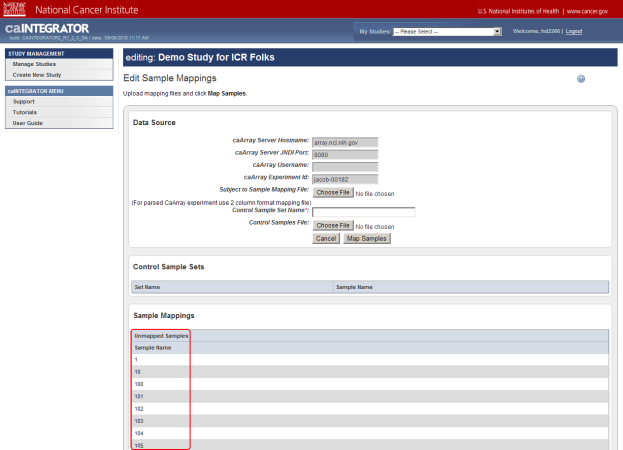
The 'Edit Sample Mappings' page shows a list of IDs for unmapped samples (highlighted in red).
Your mapping CSV file must map the subject IDs in your annotations to the sample IDs in the unmapped samples list. A screenshot of the mapping file used in this tutorial, taken from a Microsoft Excel 2007 window, is shown below. The file is a table of two columns with no headings; the first column contains IDs of the subjects from the annotation source and the second column contains IDs from the unmapped samples list. Each subject in the left column corresponds to the sample in the right column. Note that the file doesn't map every single sample ID from the data source.
This CSV file maps the subject IDs from our annotation source (left column) to the sample IDs in our genomic source (right column).
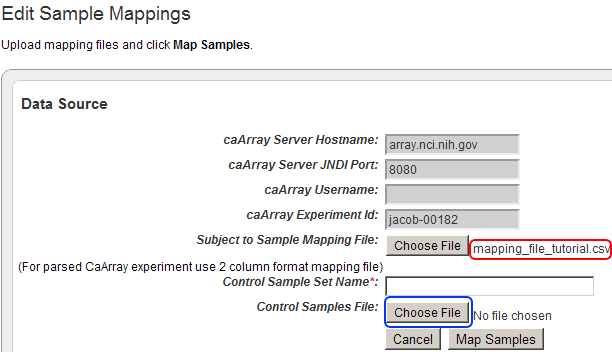
To add your mapping CSV file to the study, click on the 'Choose File' button next to the 'Subject to Sample Mapping File' label.
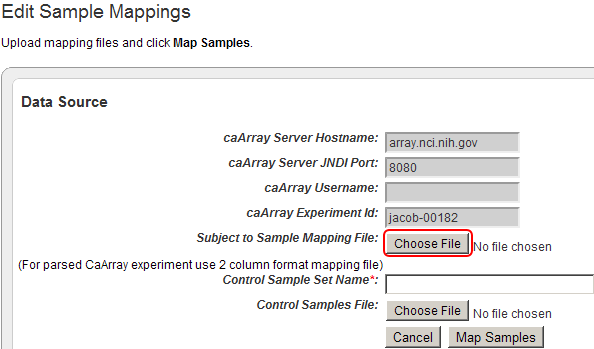
Click on the 'Choose File' button (highlighted in red) to choose a mapping file to open.
In the Open dialog that follows, find your mapping file, click on it, and then click on the 'Open' button. (In our example, the mapping file is named 'mapping_file_tutorial.CSV'.)
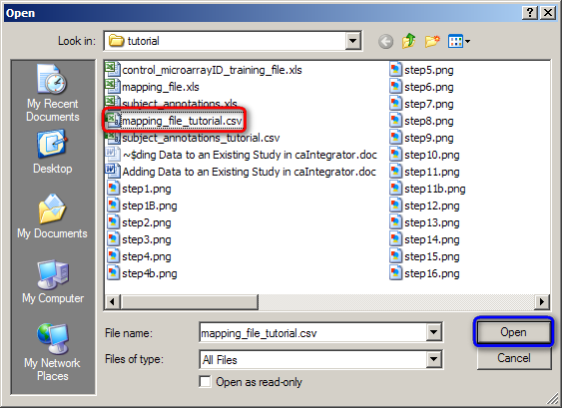
To open your mapping file, click on the 'mapping_file_tutorial.CSV' file (highlighted in red), then click on the 'Open' button (highlighted in blue).
- Back on the 'Edit Sample Mappings' page, the filename of the mapping file you just opened is now displayed to the right of the 'Choose File' button from step 26.
While the 'Edit Sample Mappings' page lists all the samples from your source (both mapped and unmapped), it doesn't indicate which of these samples came from cases and which came from controls.
Since this information may be considered important to your study, we need a way of distinguishing between the cases and controls. The way that caIntegrator addresses this need is with a 'control training file' that lists the sample IDs of all the controls. Any sample that is not listed in this file comes from a case. The screenshot below shows a portion of an example training file in CSV format from a Microsoft Excel 2007 window.
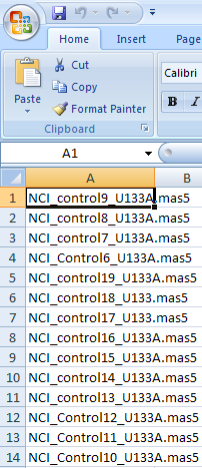
A portion of a control training file listing the sample IDs of all the controls from our example data source. You don't need to understand the format or nomenclature of the sample IDs – they were generated by the instrument or technician who ran the samples.
To add your control training CSV file to the study, click on the 'Choose File' button next to the 'Control Samples File' label.
The filename of the mapping file we just uploaded now appears next to the 'Choose File' button for 'Subject to Sample Mapping File' (highlighted in red). Now click on the 'Choose File' button next to 'Control Samples File' (highlighted in blue) to begin uploading your control training file.
In the Open dialog that follows, find your mapping file, click on it, and then click on the 'Open' button. (In our example, the mapping file is named 'control_training_file_tutorial.CSV'.)
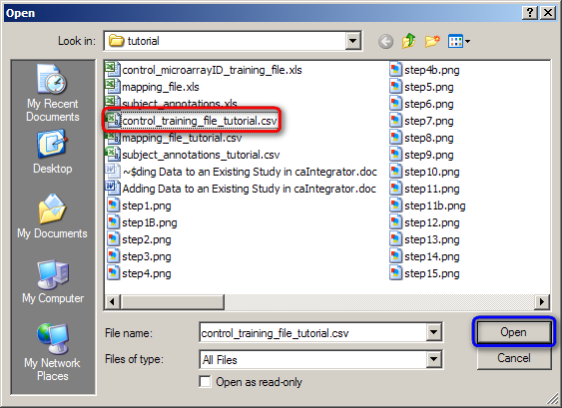
Click on the 'control_training_file_tutorial.CSV' file (highlighted in red), then click on the 'Open' button (highlighted in blue).
- Back on the 'Edit Sample Mappings' page, the filename of the control training file you just opened is now displayed to the right of the 'Choose File' button from step 26. Now enter a name for the control sample set in the 'Control Sample Set Name' text field (our example uses 'tutorial controls'), then click on the 'Map Samples' button to map your samples.
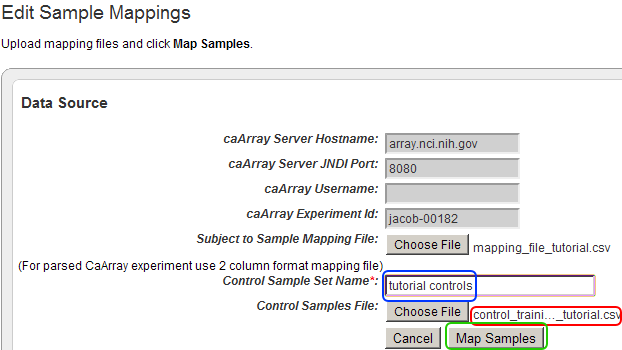
The filename of the control training file you just uploaded now appears to the right of the 'Choose File' button (highlighted in red). Enter a title into the 'Control Sample Set Name' text field (highlighted in blue), then click on the 'Map Samples' button (highlighted in green) to map your samples.
- Back on the 'Edit Study' page, the new mapping and control files we uploaded are now listed under the File Description column, while the Status has changed from 'Not mapped' to 'Ready to be loaded'. We are now done mapping our samples and are ready to query them.
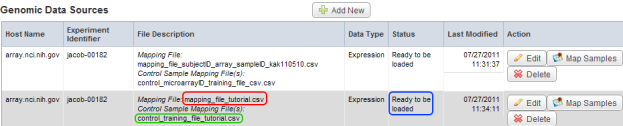
The mapping file we uploaded now appears under the File Description column and is highlighted in red, while the control file we uploaded is highlighted in green. Under the Status column, the status has changed from 'Not mapped' to 'Ready to be loaded' (highlighted in blue).
- To see what obstacles may arise in the course of loading mapping data, let's try another file. This one, named 'duplicate_mapping_file_tutorial.CSV', will replace the one we loaded in steps 26 to 28. A partial screenshot of this file, taken from a Microsoft Excel 2007 window, is shown below.
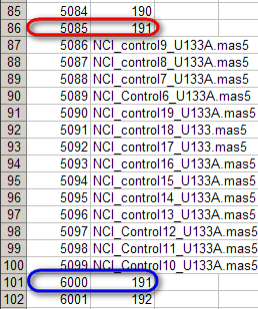
In this mapping file, the same sample (ID 191) is mapped twice, once to subject ID 5085 (highlighted in red) and again to subject ID 6000 (highlighted in blue).
You may notice something unusual about this mappings: the same sample ID (191) is mapped twice, and each mapping is to a different subject ID (5085 in one case, 6000 to another). This is obviously an error in the mappings, as each sample is taken from a single subject and must be unique to that subject. However, the question remains, what happens when we attempt to load these mappings into the study?
Surprisingly, when we repeat the procedure for loading mappings with the 'duplicate_mapping_file_tutorial.CSV', caIntegrator does not display any error message, and its source's status shows as 'Ready to be loaded' in the 'Genomic Data Sources' table, as was the case with the previous mapping file we loaded successfully. Does this mean that caIntegrator allows multiple mappings of the same sample to different subjects?
![]()
When loading an invalid mapping file, caIntegrator does not display any error messages and shows the status of the invalidly mapped source as 'Ready to be loaded' (highlighted in red).
- As it turns out, when caIntegrator parses a mapping file in which the same sample is mapped to multiple subjects and encounters a sample ID that has already been mapped, it will overwrite the old mapping with the new one. We can confirm this by clicking on the 'Map Samples' button for the source we mapped and examining the 'Samples Mapped to Subjects' table on the 'Edit Sample Mappings' page.
![]()
![]()
On the 'Edit Sample Mappings' page, sample ID 191 is only mapped to a single subject (highlighted in red), even though the mapping file we just loaded mapped that same sample twice.
As you can see, the mapping table shows only one mapping for sample ID 191, even though this sample was mapped to two different subjects in the new mapping file we just loaded. The subject ID it's mapped to is 6000 (the second one in the mapping file), not 5085 (the fist one in the mapping file). This means that caIntegrator overwrote the first mapping of sample ID 191 with the second one.
We've learned a valuable lesson from this exercise: be sure to check your mapping file for any duplicates before loading it into your study, as caIntegrator does not perform this check for you!
Querying Array and Mapping Data
- On the 'Edit Study' page, click on the 'My Studies' drop-down list in the blue banner at the top, then click on 'Demo Study for ICR Folks'.

Click on the 'My Studies' drop-down list (highlighted in red), then click on 'Demo Study for ICR Folks' (highlighted in blue).
- On the 'Welcome' page, click on the 'Search Demo Study for ICR Folks' link under the 'DEMO STUDY FOR ICR FOLKS' heading in the navigation panel at the left.
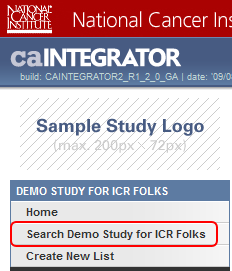
Click on 'Search Demo Study for ICR Folks' (highlighted in red) to begin querying the study.
- On the 'Search' page, click on the drop-down list under the 'Define Query Criteria' heading. The list shows the different criteria we can query the study by. Since we want to query genomic data, click on 'Gene Expression', then click on the 'Add' button to the right of the list.
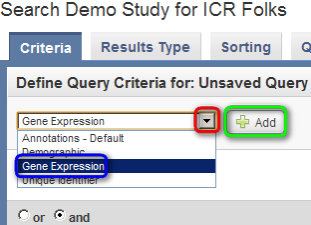
Click on the 'Define Query Criteria' drop-down list (highlighted in red), then click on 'Gene Expression' (highlighted in blue) and click on the 'Add' button (highlighted in green).
- When querying by gene name, you can either search for a gene symbol or for a fold change. In this example, we'll search by the gene symbol. Click on the 'Gene Name' drop-down list, then click on the 'Gene Name' list entry.
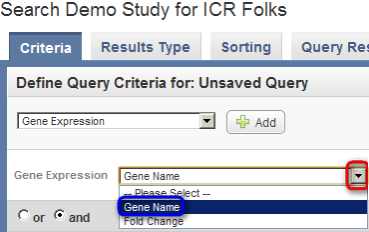
Click on the 'Gene Name' drop-down list (highlighted in red), then click on the 'Gene Name' list entry (highlighted in blue).
- In the gene symbol text field that appears to the right, type in 'EGFR' (the symbol for the epidermal growth factor gene), then click on the 'Run Query' button below.
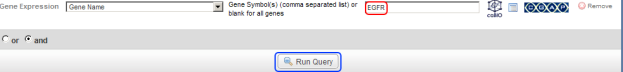
Type 'EGFR' into the 'Gene Symbol' text field (highlighted in red), then click on the 'Run Query' button (highlighted in blue).
- The query results appear under the 'Query Results' tab as a table of subject IDs for those with available EGFR expression data. Note that these results include subjects not only from the genomic sources that we uploaded in this tutorial, but also from the pre-existing ones. You can confirm this by noting that some of the subject IDs in the results screenshot below (i.e., 10, 309) fall outside the range of IDs from the annotation file we previously uploaded (i.e., 5000 to 5099).
You can sort these results in numerical order of subject ID by clicking on the 'Subject ID' heading above the right table column.
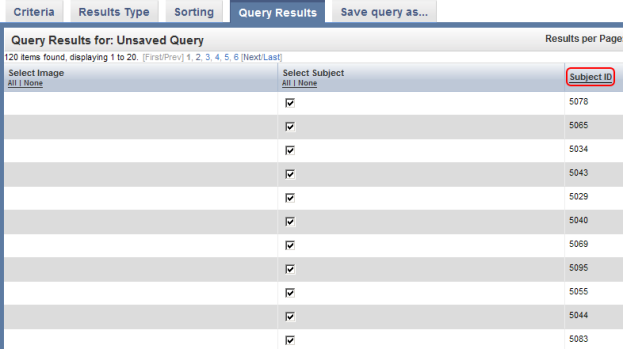
Click on the Subject ID column heading (highlighted in red) to sort the EGFR gene query results.
- As it stands, these query results are not very useful, as they only show which subjects have EGFR expression data and don't show the actual data itself. To change this, click on the 'Results Type' tab at the top of the page, then click on the 'Gene Expression' radio button under the 'Select Results Type' heading. This will change the query results to display one or more numerical values which indicate the expression levels of the EGFR gene for each sample.
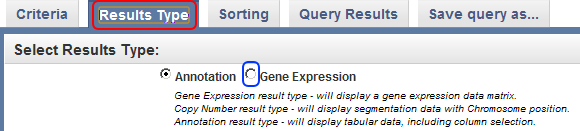
Click on the 'Results Type' tab (highlighted in red), then click on the 'Gene Expression' button (highlighted in blue).
- In the query results, we can choose to display every EGFR expression value for a given sample, or to display a single value which represents the median of that sample's values. For simplicity's sake, let's choose the latter option by clicking on the 'Gene' button next to 'Select Reporter Type', then clicking on the 'Run Query' button to display the results.
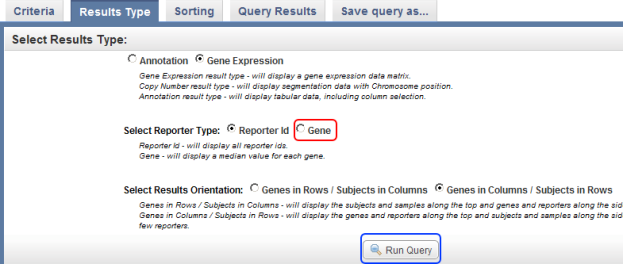
Click on the 'Gene' button (highlighted in red) to display a single value representing each subject's EGFR expression levels in the query results, then click on the Run Query button (highlighted in blue) to display the results.
- Back on the 'Query Results' page, there are now two additional columns of data: Sample ID and EGFR. The value in the EGFR column represents the median of the gene's expression levels for the corresponding subject and sample. Note that the screenshot below only displays the first five results in the list; you can scroll down the list via the bar at the right to view the rest of the results.
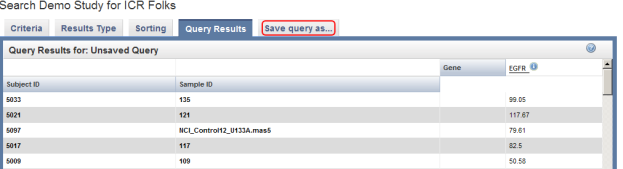
The query results now show two additional columns: Sample ID and EGFR. The latter represents median EGFR expression values. Click on the 'Save query as…' tab (highlighted in red) to save these results for future reference.
To save this query in caIntegrator for future reference, click on the 'Save query as..' tab at the top of the page, enter a name and description for the query in the respective fields, and click on the 'Save Query' button at the bottom.
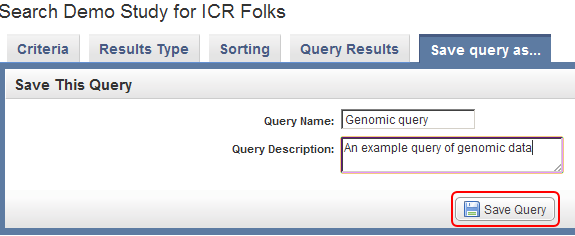
Enter a query name and query description in the respective text fields, then click on the 'Save Query' button (highlighted in red) to save the query for future reference.
- Once the query is saved, the Search page will reload and the Study Data menu in the left navigation panel will expand to show the newly saved 'Genomic Query' under the 'My Queries' heading. You can click on the magnifying glass icon to the left of the Query link to bring up the query results again, or on the pencil icon to edit the query criteria.
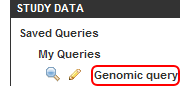
The newly saved 'Genomic query' (highlighted in red) is shown in the 'Study Data' menu under 'My Queries'.
Have a comment?
Please leave your comment in the caIntegrator End User Forum.