Problem: How to combine annotation and gene expression data when displaying query results
Topic: caIntegrator Usage
Date entered: 08/23/2011
Release: Up to caIntegrator 1.3
Solution
caIntegrator allows users to query studies by both clinical annotation data (i.e., subject age and gender) and by gene expression data (i.e., numerical reporter IDs representing gene expression levels). When displaying the results for a compound query, caIntegrator can display either the annotation data or the gene expression data individually, but it lacks the ability to display the two together side-by-side.
This how-to guide presents two different workarounds for this limitation. The first, and less sophisticated workaround, involves manually exporting the annotation and expression data separately as spreadsheet files, then merging the two spreadsheets afterwards. The second workaround, only available with caIntegrator version 1.3 or later, involves visualizing the data in the form of color-coded maps via a newly added featured known as the Integrative Genomics Viewer (IGV).
Querying the Data
First, let's do a sample query of a caIntegrator study to illustrate the limitations in displaying query results. In our example, the study we will query is entitled 'TCGA Ovarian', which is selected in the 'Public Studies' drop-down list at the top of the caIntegrator home page. To start querying, click on the 'Search TCGA Ovarian' link in the navigation menu at the left.
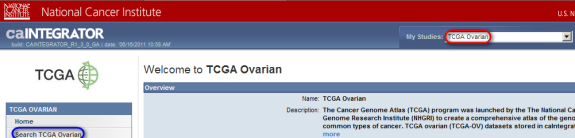
To begin a sample query of the 'TCGA Ovarian' study (highlighted in red), click on the 'Search TCGA Ovarian' link (highlighted in blue).
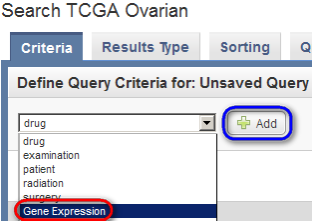
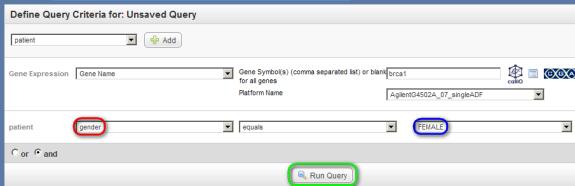
Next, on the 'Search' page, under the 'Criteria' tab, select 'Gene Expression' from the drop-down list, then click on the 'Add' button to the right.
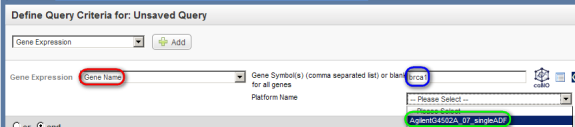
In the 'Gene Expression' drop-down list that appears below, select 'Gene Name', then in the 'Gene Symbol' field to its right, type in 'BRCA1', and in the 'Platform Name' drop-down list, select the entry that begins with the phrase 'Agilent'.
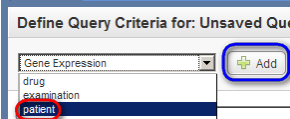
Next, go back to the top drop-down list, and this time select 'patient', then click on the 'Add' button again.
In the 'patient' drop-down list that appears below, select 'Gender', then in the drop-down list to its right, select 'Female', and finally, click on the 'Run Query' button at the bottom.
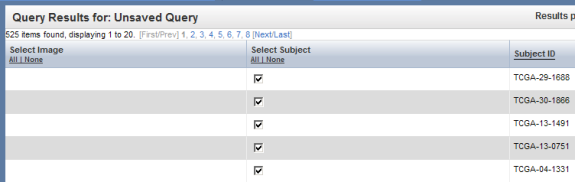
The results are displayed under the 'Query Results' tab as a list of subject IDs who meet the specified criteria (i.e., female subjects with available expression data for the BRCA1 gene).
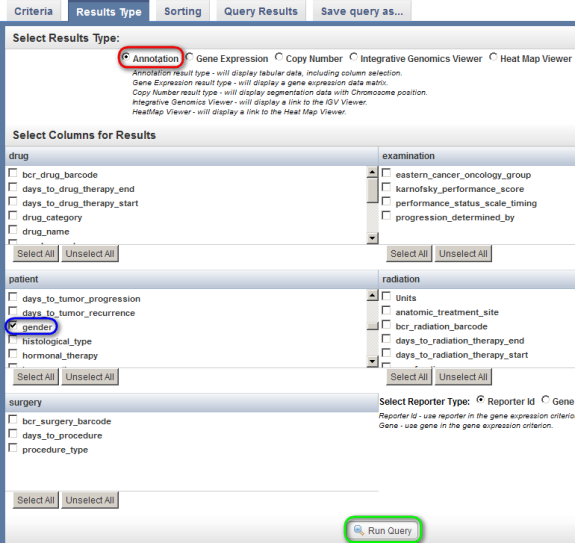
You can customize these results by first clicking on the 'Results Type' tab at the top. To show the annotation data in the results, first make sure that the 'Annotation' button is selected under the 'Select Results Type' heading, then check off 'gender' in the scrollable list box under the 'patient' heading, and finally, click on the 'Run Query' button at the bottom.
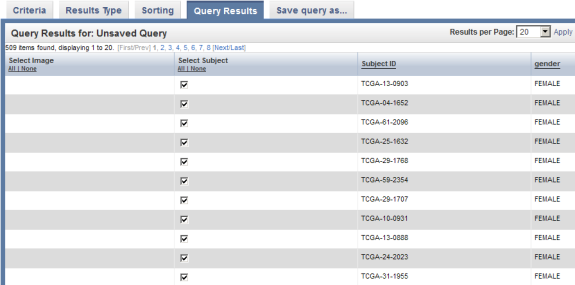
Now, the 'Query Results' tab re-appears with updated results – namely, a new column headed 'Gender' to the right of the 'Subject ID' column.
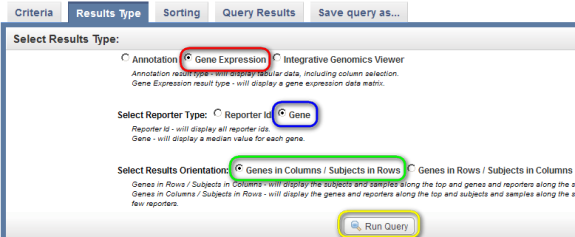
To show the gene expression data in the results, click back on the 'Results Type' tab at the top, then select the 'Gene Expression' button under 'Select Results Type', the 'Gene' button next to 'Select Reporter Type', and the 'Genes in Columns' button next to 'Select Results Orientation'. Finally, click on the 'Run Query' button at the bottom.
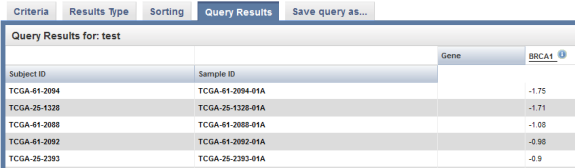
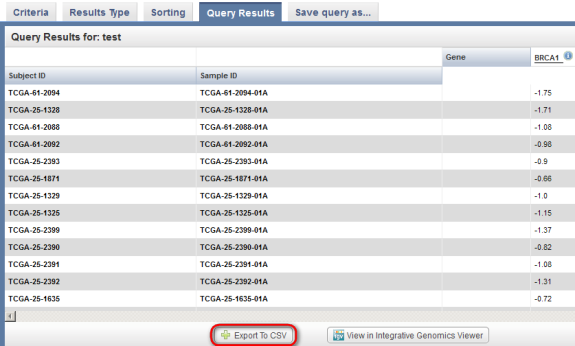
The results are displayed under the 'Query Results' tab as a list of subject IDs with available BRCA1 expression data, with the corresponding sample IDs and expression levels for each subject.
Workaround 1: Manually Exporting Spreadsheets
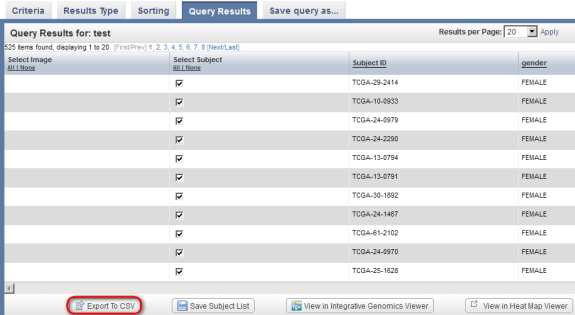
So far, we've seen that caIntegrator can display annotation and gene expression query results individually, but not side-by-side. One workaround for this limitation is to manually export the annotation and expression data separately as spreadsheet files, then merge the two spreadsheets afterwards. To begin, let's go back to the 'Query Results' tab for the annotation results type and click on the 'Export to CSV' button at the bottom left.
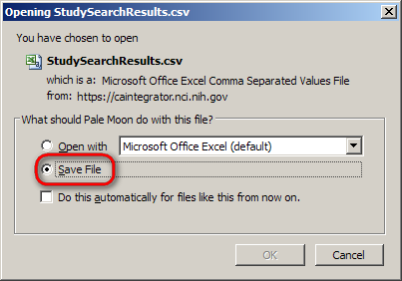
A dialog will then appear prompting you whether you want to open or save the CSV file. Click on the 'Save File' button, then click on 'OK' below it.
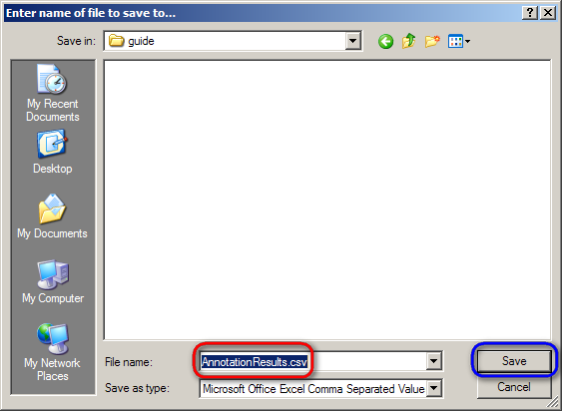
Another dialog will then appear prompting you for the name and location of the saved file. Choose a convenient location to save the file to from the drop-down list at the top, then enter 'AnnotationResults.csv' for the file name and click on the 'Save' button.
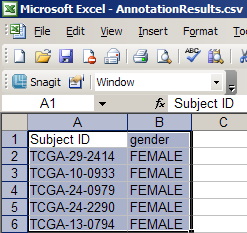
Next, let's open the CSV file we just saved in a spreadsheet application. In this guide, we'll use Microsoft Excel 2003. A partial screenshot of the Excel window is shown below. The spreadsheet consists of two columns: 'Subject ID' and 'Gender'.
Now, go back to the 'Query Results' tab for the gene expression results type and click on the 'Export to CSV' button at the bottom left.
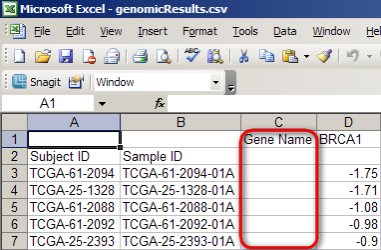
Then, repeat the steps we followed previously to save the resulting CSV file as 'genomicResults.CSV' and open it in Excel. A partial screenshot of the Excel window is shown below. The spreadsheet consists of four columns: 'Subject ID', 'Sample ID', 'Gene Name', and 'BRCA1'. Since the 'Gene Name' column is empty, we can delete it, leaving three columns.
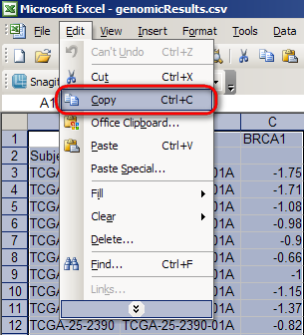
Now, highlight the entire contents of the spreadsheet (527 rows total), then select 'Copy' from the 'Edit' menu.
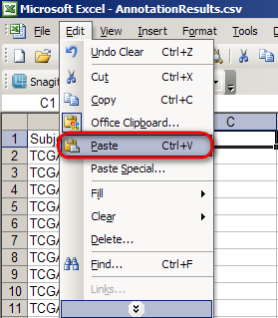
Finally, switch back to the 'AnnotationResults.csv' spreadsheet, click on the empty cell to the right
of the 'Gender' column heading, and select 'Paste' from the 'Edit' menu.
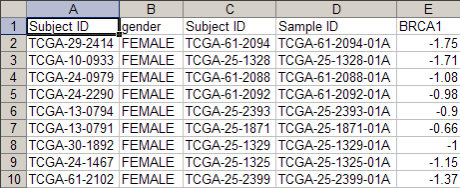
The resulting spreadsheet should appear as in the screenshot below of the first ten rows:
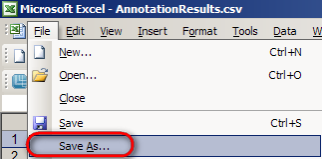
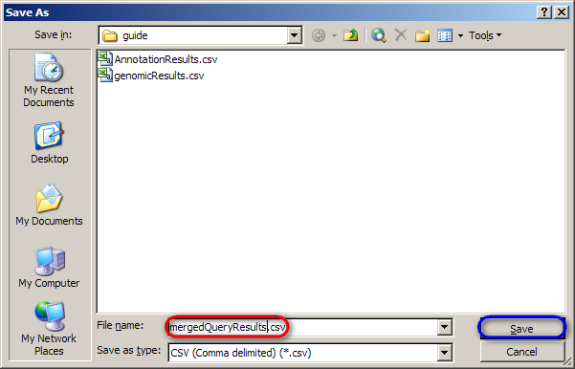
Finally, save the merged spreadsheet by selecting 'Save As' from the 'File' menu, then entering 'mergedQueryResults.csv' as the file name in the 'Save As' dialog and clicking on the 'Save' button.
Workaround 2: The Integrated Genomics Viewer (IGV)
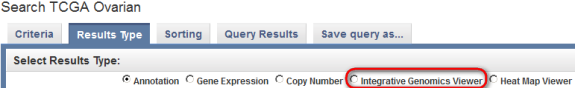
The other workaround for caIntegrator's limited options for displaying query results is a newly added featured known as the Integrative Genomics Viewer (IGV), which allows the annotation and expression data to be visualized side-by-side in the form of color-coded maps. To begin using the IGV, switch back to the 'Results Type' tab on the 'Search TCGA Ovarian' page and click on the 'Integrative Genomics Viewer' button under the 'Select Results Type' heading.
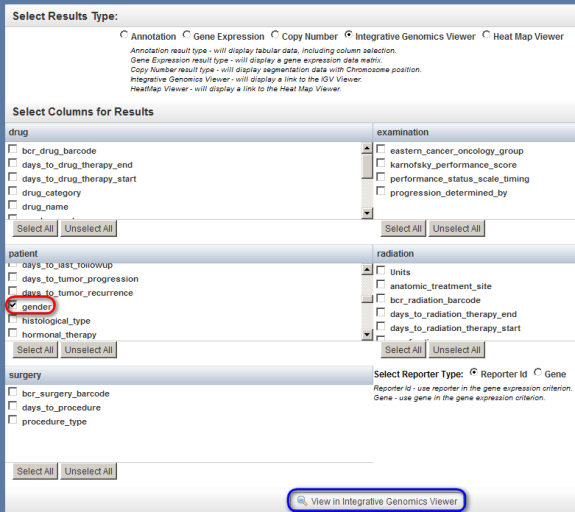
Next, check off 'gender' in the scrollable list box under the 'patient' heading, and finally, click on the 'View in Integrative Genomics Viewer' button at the bottom.
NOTE: Before you launch the IGV, make sure you have version 6 or later of the Java Runtime Environment (JRE) installed on your machine. The JRE can be downloaded from the Oracle Web site at http://www.oracle.com/technetwork/java/javase/downloads/jre-6u27-download-440425.html
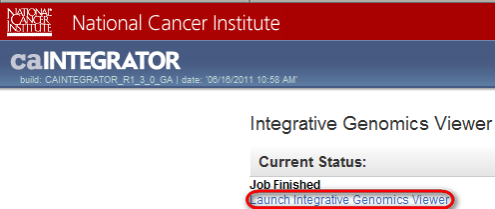
Now, a new window will open in your Web browser entitled 'Integrative Genomics Viewer'. Click on the blue link entitled 'Launch Integrative Genomics Viewer'.
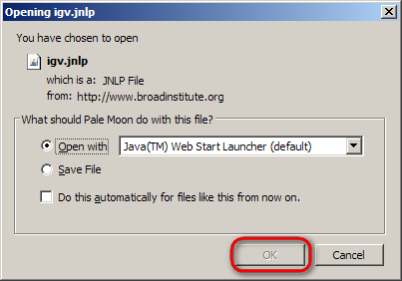
Assuming that you have the JRE properly installed, you should now see a dialog entitled 'Opening igv.jnlp'. Make sure that the 'Open with' button is selected, then click on the 'OK' button at the bottom to launch the IGV.
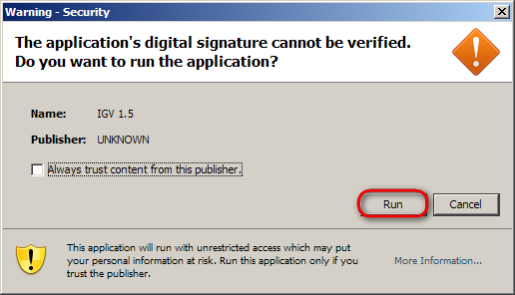
Depending on how the JRE is configured on your machine, you may see a dialog entitled 'Warning – Security' stating, 'The application's digital signature cannot be verified. Do you want to run the application?' If this is the case, simply click on the 'Run' button at the bottom to continue.
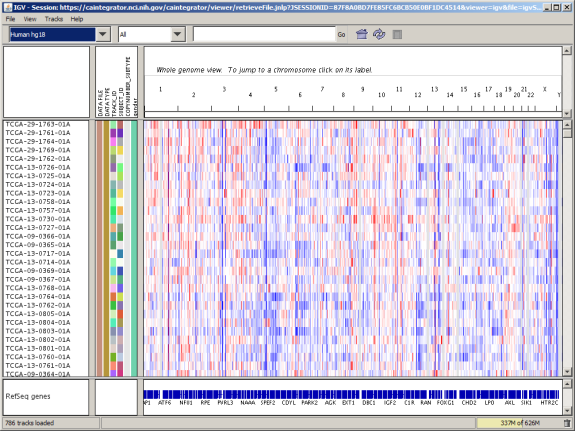
The main IGV window is shown below. The application is complex and thus its documentation is beyond the scope of this tutorial. For an in-depth tutorial, visit the official IGV Web site, hosted by the Broad Institute of Harvard and MIT, at http://www.broadinstitute.org/igv/QuickStart.
Have a comment?
Please leave your comment in the caIntegrator End User Forum.