Page History
| Scrollbar | ||
|---|---|---|
|
...
| Page info | ||||
|---|---|---|---|---|
|
This chapter describes the processes for searching studies within caIntegrator.
...
- In caIntegrator, in the upper right hand corner, select the study you want to browse or perform a simple search.
- On the left sidebar, under the first section that displays the study name, click Search [Study Name]. This opens a simple search query page with five tabs.
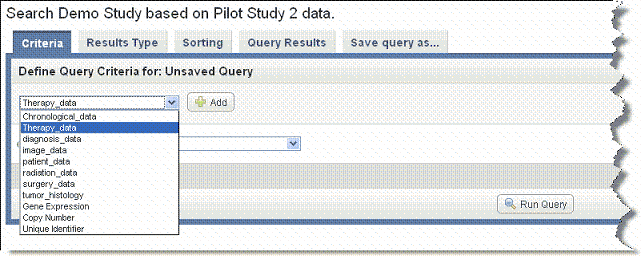
- On the Criteria tab, shown in the following figure, in the drop-down list, select the type of data you want to search.
- You can perform a search using one or more criteria you set in one of the data types, or you can define criteria in more than one data type per query, creating a more complex search.
- Annotations (listed as 'default' or by annotation group name when specified when the study was created)
- Gene Expression or Copy Number
- Image Series
- Click Add to further define criteria for the search.
Continue with:
Annotation and Image Data Searches
Gene Expression Searches
Copy Number Searches
CGHCalls Searches - To add additional criteria for the search, repeat steps 4 and 5, as appropriate. You can set more than one data type or more than one criterion for a data type. The criteria become cumulative, thus refining the search.
- Once you have configured the query criteria, select the Boolean Or or Andsearch operator at the bottom of the page.
- Or finds a data subset with at least one of the search criteria
- And finds a data subset with both/or all search criteria.
- Click the Remove button to clear any data elements you have defined.
- You can launch the search from this Criteria tab. Click the Run Search button. For information about the search results, see 5 - Viewing Query Results. You may want to run the search first to see what kind of results you get before you configure the data display, described in step 10.
– or – On the Results Type tab, you can specify the columns you want to display in the search results data. On the Sorting tab, you can specify how the data is to be sorted. For more information, see Results Type Tab and Sorting Tab.
Note title Be Careful As long as you are still in the current query session, you can return to the Criteria, Columns and Sorting tabs to add, modify or remove data and display criteria and re-run the search. If you configure another query without saving the first, the first query will be lost. If you save the query, your current search criteria are saved.
Annotation and Image Data Searches
| Info | ||
|---|---|---|
| ||
If the study manager defined the study's own annotation groups, then those group names are listed in the criteria drop-down list. If the study manager did not define the study's annotation groups when the study was created, then all annotations are placed, by default, in a group called "Annotations default". |
...
| Include Page | ||||
|---|---|---|---|---|
|
| Include Page | ||||
|---|---|---|---|---|
|
Expression Level Selection
Additional fields display for the Expression Level selection.
- Select the range type from the following options:
- >=: Greater than the entered value
- <=: Less than the entered value
- Inside Range: Looks for all matching values that occur between the two levels you enter
- Outside Range: Looks for all matching values that are not in between the two levels that you enter.
The range of possible values is determined on the array side; the value is affected by the array type and the sample's behavior.
- Enter the Expression Level appropriate for your query. The value that you enter is compared to the expression levels that are reported by the probes on the array platform. The probe value is typically a normalized value.This criteria changes slightly based the range type you select.
The default value of 100 is a fixed default and does not reflect any values on the array. It simply represents a starting point for the query. - Continue with step 6 in Searching a caIntegrator Study.
Fold Change Selection
Additional fields display for the Fold Change selection. The fold change option appears only if genomic control samples have been uploaded to the study. Fold change identifies genes with expression differences compared to control samples, as defined when the study was deployed in caIntegrator. You can enter query values in greater/lesser-than-or-equal-to arguments.
...
After running a search, you can export the result set or a subset as a tab-delimited text file. For more information, see Exporting Data.
...
| Scrollbar | ||
|---|---|---|
|