This chapter describes the processes for searching studies within caIntegrator.
Topics in this chapter include:
Search Overview
The search and browse functions in caIntegrator allow you to search for subject annotation data, genomic data or imaging data that were uploaded into the application as part of a study. When gene expression and imaging data are uploaded into a caIntegrator study, mapping files that correlate sample IDs in those files to subject IDs (patient IDs) in the subject annotation data file must also be uploaded. When you launch a search, caIntegrator finds and integrates the subject annotation, genomic and imaging data based on the mapping files and the criteria that you define in the search query.
In a search query, you can specify criteria for just one of the data types, or configure complex search criteria that join two or three data types. The available criteria for the query were defined when the study was deployed.
The basic workflow for a study search follows these steps:
- Select the study to be searched.
- Select one data type:
- [Annotations] – Annotation data can be labeled 'default' or given the annotation 'group' name when annotation groups are specified by the manager, for example, chronologic, therapy, diagnosis, patient, or other annotation group types. This selection searches one or more uploaded CSV files for data identifiers or annotations (column headers) specified during study creation.
- [Genomic] – Genomic data can be gene expression or copy number data. This selection searches caArray experiments samples uploaded in the study for gene expression or copy number data by gene name, reporter ID, chromosome number, chromosome coordinates and/or segmentation values representing amplification or deletion.
- Image Data – This selection searches NBIA imaging files uploaded in the study for image annotations or links to images, identified by subject identifiers or image series IDs.
- Define criteria for the search in the selected data type and run the search.
- For a more complex search, select multiple criteria from more than one data type.
- Specify whether you want subject/imaging annotations to display or genomic data to display.
- Review search results.
- Configure results column and sorting display settings. You can do this before or after you run a search. If you choose to do it after, you must re-run the search.
- Download annotation search results as a CSV file. The CSV file contains only the data you specified in the annotation and display configurations.
- Follow links to NBIA in the search results to view or download images located in the search.
Searching a caIntegrator Study
To initiate a search of all annotations and/or other data in a study, follow these steps:
- In caIntegrator, in the upper right hand corner, select the study you want to browse or perform a simple search.
- On the left sidebar, under the first section that displays the study name, click Search [Study Name]. This opens a simple search query page with five tabs.
- On the Criteria tab, shown in the following figure, in the drop-down list, select the type of data you want to search.
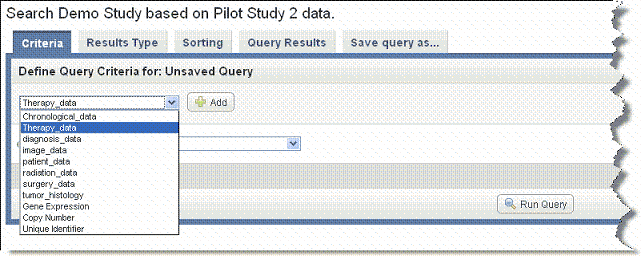
- You can perform a search using one or more criteria you set in one of the data types, or you can define criteria in more than one data type per query, creating a more complex search.
- Annotations (listed as 'default' or by annotation group name when specified when the study was created)
- Gene Expression or Copy Number
- Image Series
- Click Add to further define criteria for the search.
Continue with:
Annotation and Image Data Searches
Gene Expression Searches
Copy Number Searches
CGHCalls Searches - To add additional criteria for the search, repeat steps 4 and 5, as appropriate. You can set more than one data type or more than one criterion for a data type. The criteria become cumulative, thus refining the search.
- Once you have configured the query criteria, select the Boolean Or or Andsearch operator at the bottom of the page.
- Or finds a data subset with at least one of the search criteria
- And finds a data subset with both/or all search criteria.
- Click the Remove button to clear any data elements you have defined.
- You can launch the search from this Criteria tab. Click the Run Search button. For information about the search results, see 5 - Viewing Query Results. You may want to run the search first to see what kind of results you get before you configure the data display, described in step 10.
– or – On the Results Type tab, you can specify the columns you want to display in the search results data. On the Sorting tab, you can specify how the data is to be sorted. For more information, see Results Type Tab and Sorting Tab.
Be Careful
As long as you are still in the current query session, you can return to the Criteria, Columns and Sorting tabs to add, modify or remove data and display criteria and re-run the search. If you configure another query without saving the first, the first query will be lost. If you save the query, your current search criteria are saved.
Annotation and Image Data Searches
Annotation Groups
If the study manager defined the study's own annotation groups, then those group names are listed in the criteria drop-down list. If the study manager did not define the study's annotation groups when the study was created, then all annotations are placed, by default, in a group called "Annotations default".
Once you select an annotation group data type, an additional drop-down list displays data elements that are annotation definitions specified for that data type when the data was uploaded into the study. An example is shown in the following figure.
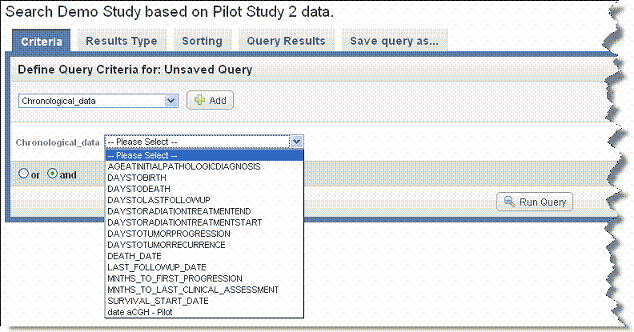
Select a search criterion from among the options. You can make only one selection at a time.
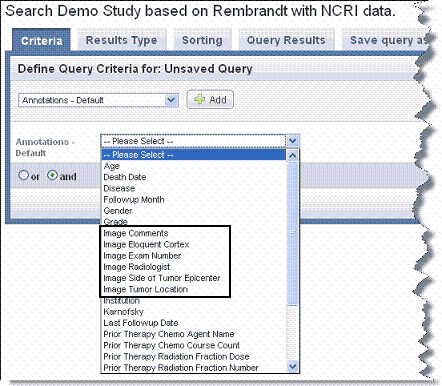
For imaging searches
If the study includes imaging data, imaging annotations should be available in the Annotations list, as shown in the following figure.
- Each choice opens other fields relevant to the selection where you can further define your search query.
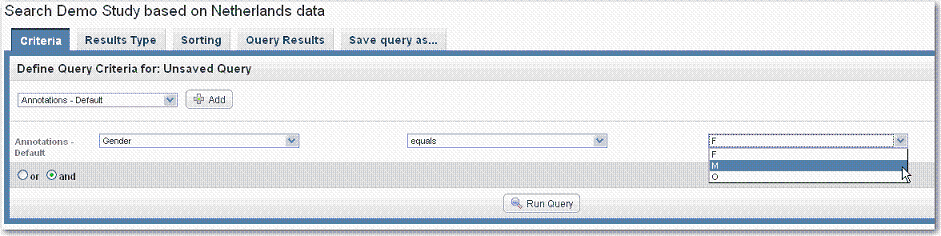
- If permissible values were added when the annotation was defined, you must select among the values in a drop-list that displays on the right side of the page. An example is shown in the following figure.
If no permissible values were defined as part of the annotation, you have the option to enter descriptive text in a text box on the right side of the page.
Caution
When working with image data, if only an imaging mapping file was uploaded when the study was created and not an image series annotation file, you cannot enter image search criteria. The search results will, however, display a link that allows you to view the associated images in NBIA.
- Continue with step 6 in Searching a caIntegrator Study.
Gene Expression Searches
For a gene expression search, follow these steps:
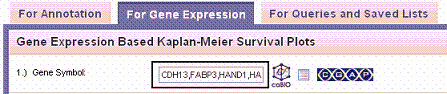
For the Gene Expression selection, select Gene Name, Expression Level or Fold Change. Follow the links for descriptions about each selection. Additional search fields will display upon selection. If the study includes multiple platforms, a Platform option is also visible.
Gene Names Search
caIntegrator provides three methods whereby you can obtain gene names for a search. See Choosing Genes.
Blank gene symbols field
If you leave the gene symbols field blank, caIntegrator searches all gene symbols for a match to the other criteria you specify.
Choosing Genes
To obtain gene names for a gene expression search or analysis, use one of the following three methods described in this section: bioDBnet, Gene List or CGAP.
- bioDBnet– This link searches bioDBnet for gene IDs, symbols or genes within pathways. Then caIntegrator pulls identified genes into the application for analysis.
- Click bioDBnet.
- Enter Search Terms. Note that caIntegrator can perform a search on a partial HUGO symbol. For example, as search using ACH * would find matches with 'achalasia' and 'arachidonate'.
- Select if you want to search in Gene IDs, Gene Symbols, Gene Aliases, Pathways (from the drop-down list), or Search Pathways for Genes.
- Gene IDs searches the exact gene ID(s) you enter.
- Gene Symbols searches only the Unigene and HUGO gene symbols in bioDBnet.
- Gene Aliases searches for one or more gene symbols which are synonymous for the current gene symbol.
- Pathways searches only the pathway names in bioDBnet.
- Search Pathways for Genes searches for pathways containing gene(s) you specify for the search.
- Select Show only genes that are part of this (caIntegrator) study or Case Sensitive Search if either of these criteria are to be applied to the search. (By default, the search is case insensitive.)
- Choose the Taxon from the drop-down list and click Search. (The Taxon criterion defaults to Human.) The search results display on the same page below the search criteria. The following figure shows search criteria and a few of the listed search results.
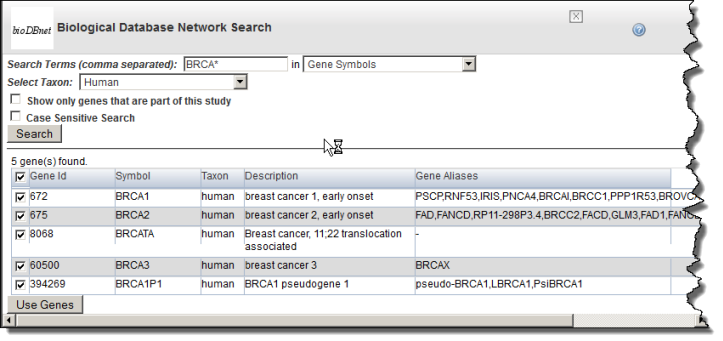
- In the search results, use the check boxes to identify the genes whose symbols you want to use in the gene expression analysis.
- Click Use Genes at the bottom of the page. This pulls the checked genes into the Gene Symbol text box on the Criteria tab. The following figure reveals some of the genes pulled into the Gene Symbol text box.
- Gene List– This link locates gene lists saved in caIntegrator.
- Click the Genes List icon (
 ) to open a Gene List Picker dialog. For more information, see Creating a Gene or Subject List.
If a GISTIC analysis has been run, you may see the following options:- GISTIC Amplified genes is a list of gene symbols in which the corresponding regions of the genome are significantly amplified.
- GISTIC Deleted genes is a list of gene symbols in which the corresponding regions of the genome are significantly deleted.
- In the drop-down menu that lists previously saved gene lists, select a gene list. In the list that appears, use the check boxes to identify the genes whose symbols you want to use in the gene expression analysis.
- Click Use Genes at the bottom of the dialog. This pulls the checked genes into the Search Criteria tab.
- Click the Genes List icon (
- CGAP – Use this directory to identify genes. Before clicking the CGAP icon (
 ) you must enter gene symbols in the text box. This link does not pull anything into caIntegrator but does provide information about the gene(s) whose names you entered.
Expression Level Selection
Additional fields display for the Expression Level selection.
- Select the range type from the following options:
- >=: Greater than the entered value
- <=: Less than the entered value
- Inside Range: Looks for all matching values that occur between the two levels you enter
- Outside Range: Looks for all matching values that are not in between the two levels that you enter.
The range of possible values is determined on the array side; the value is affected by the array type and the sample's behavior.
- Enter the Expression Level appropriate for your query. The value that you enter is compared to the expression levels that are reported by the probes on the array platform. The probe value is typically a normalized value.This criteria changes slightly based the range type you select.
The default value of 100 is a fixed default and does not reflect any values on the array. It simply represents a starting point for the query. - Continue with step 6 in Searching a caIntegrator Study.
Fold Change Selection
Additional fields display for the Fold Change selection. The fold change option appears only if genomic control samples have been uploaded to the study. Fold change identifies genes with expression differences compared to control samples, as defined when the study was deployed in caIntegrator. You can enter query values in greater/lesser-than-or-equal-to arguments.
- Select or enter data for the Fold change fields shown in the following figure and described below.

- Gene Symbol - See Gene Names Search.
- Control Sample Set – If multiple platforms are part of the study, your platform selection in the Fold Change query criteria determines the control samples that are available.
Select from the drop down list the name of the uploaded control sample set to serve as the fold change reference. - Regulation Type – Select the term that describes the gene expression in comparison with the control samples: Up is increased expression; Down is decreased expression; Up or Down is increased or decreased; Unchanged means no change in expression.
- Up-regulation Folds – Enter a numerical value representing fold change. The number you enter here is dependent upon the Regulation Type you selected.
- Up = Up Regulation Folds – Samples with a fold change greater than this value, when compared to the control samples, will be returned.
- Down = Down Regulation Folds – Samples with a fold change less than this value, when compared to the control samples, will be returned.
- Up or Down = Down Regulations Folds, Up Regulation Folds – Samples with a fold change either up or down, when compared to the control samples, will be returned.
- Unchanged = Samples with a fold change between the two specified values will be returned.
For example, if you enter 2.0 in this field, after selecting Up in the previous field, the search will locate genes whose expression is 2 times (2-fold up regulation) the base value.
- Continue with step 6 in Searching a caIntegrator Study.
Copy Number Searches
In some diseases, like cancer, cells that are abnormal can exhibit a change in the chromosomal structure in that parts of a chromosome can be amplified or deleted. 'Copy number' experiments that measure variation in genomic structure use molecular markers to detect amplification or deletion of chromosomal segments. Typically, copy number alteration experiments compare a genomic sample from a diseased tissue (for example, a tumor) to a control sample (for example, blood).
The Copy Number query option, as described in Searching a caIntegrator Study, appears only if copy number data have been uploaded to the study. A copy number search identifies subjects or samples that have a copy number amplification or deletion in the genome range specified. Searches can be constructed with gene names, chromosome number and/or chromosome coordinates. You can enter query values in greater/lesser-than-or-equal-to arguments.
For the Copy Number selection, select Gene Name or Segmentation.
Gene Names Search
caIntegrator provides three methods whereby you can obtain gene names for a search. See Choosing Genes.
Blank gene symbols field
If you leave the gene symbols field blank, caIntegrator searches all gene symbols for a match to the other criteria you specify.
Segmentation Search
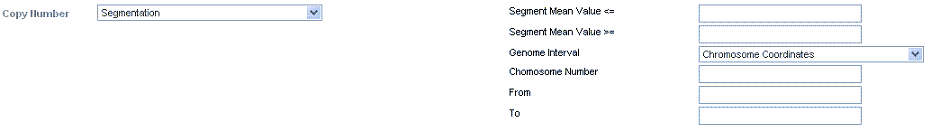
Additional fields display for the Segmentation selection. Segmentation is the process of defining the chromosomal boundaries (coordinates) of the region deleted or amplified in the sample.
- Select or enter data for the copy number query fields shown in the following figure and described below.
 .
.- Segment Mean <= – Enter the value equal to or less than the higher limit of change.
- Segment Mean >= – Enter the value equal to or greater than the lower limit of change.
- Genome Interval > Gene Name – See Choosing Genes.
- Genome Interval > Chromosome Number – In the text box that opens, enter the chromosome number you want the query to search against.
- Genome Interval > Chromosome Coordinates – In the From and To text boxes that open, enter the range on the chromosome you want to search. This defines the chromosomal boundaries of the region with the suspected copy number variations.
The Bioconductor DNAcopy algorithm (see Copy Number Data) identifies the location of the amplification or deletion and then reports it as the base pair at the start and stop of the segment. Each segment is then catalogued with chromosome number, start coordinate, stop coordinate, genes in the segment, and the segment mean value. - To search for Gene Symbols, see Choosing Genes.
- Continue with step 6 in Searching a caIntegrator Study.
CGHCalls Searches
Additional fields display for the Calls selection. CGHCalls calls aberrations for array CGH data using a six state mixture model.
- Select or enter data for the copy number query fields shown in the following figure and described below.
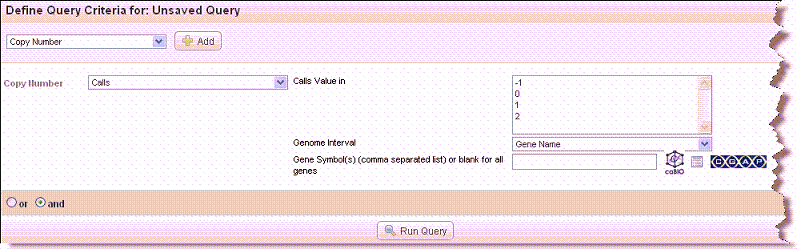
- Copy Number values: Select one or more of the Calls values. Values are -1 (loss), 0 (normal) or 1, (gain). If four levels were used for calling, a value of 2 represents an amplification.
- Genome Interval > Gene Name – See Gene Names Search.
- Genome Interval > Chromosome Number – In the text box that opens, enter the chromosome number you want the query to search against.
Genome Interval > Chromosome Coordinates – In the From and To text boxes that open, enter the range on the chromosome you want to search. This defines the chromosomal boundaries of the region with the suspected copy number variations.
For more information about CGHCalls, see CGHcalls .
.- To search for Gene Symbols, see Choosing Genes.
- Continue with step 6 in Searching a caIntegrator Study.
Choosing Genes
To obtain gene names for a gene expression search or analysis, use one of the following three methods described in this section: bioDBnet, Gene List or CGAP.
- bioDBnet– This link searches bioDBnet for gene IDs, symbols or genes within pathways. Then caIntegrator pulls identified genes into the application for analysis.
- Click bioDBnet.
- Enter Search Terms. Note that caIntegrator can perform a search on a partial HUGO symbol. For example, as search using ACH * would find matches with 'achalasia' and 'arachidonate'.
- Select if you want to search in Gene IDs, Gene Symbols, Gene Aliases, Pathways (from the drop-down list), or Search Pathways for Genes.
- Gene IDs searches the exact gene ID(s) you enter.
- Gene Symbols searches only the Unigene and HUGO gene symbols in bioDBnet.
- Gene Aliases searches for one or more gene symbols which are synonymous for the current gene symbol.
- Pathways searches only the pathway names in bioDBnet.
- Search Pathways for Genes searches for pathways containing gene(s) you specify for the search.
- Select Show only genes that are part of this (caIntegrator) study or Case Sensitive Search if either of these criteria are to be applied to the search. (By default, the search is case insensitive.)
- Choose the Taxon from the drop-down list and click Search. (The Taxon criterion defaults to Human.) The search results display on the same page below the search criteria. The following figure shows search criteria and a few of the listed search results.
- In the search results, use the check boxes to identify the genes whose symbols you want to use in the gene expression analysis.
- Click Use Genes at the bottom of the page. This pulls the checked genes into the Gene Symbol text box on the Criteria tab. The following figure reveals some of the genes pulled into the Gene Symbol text box.
- Gene List– This link locates gene lists saved in caIntegrator.
- Click the Genes List icon () to open a Gene List Picker dialog. For more information, see Creating a Gene or Subject List.
If a GISTIC analysis has been run, you may see the following options:- GISTIC Amplified genes is a list of gene symbols in which the corresponding regions of the genome are significantly amplified.
- GISTIC Deleted genes is a list of gene symbols in which the corresponding regions of the genome are significantly deleted.
- In the drop-down menu that lists previously saved gene lists, select a gene list. In the list that appears, use the check boxes to identify the genes whose symbols you want to use in the gene expression analysis.
- Click Use Genes at the bottom of the dialog. This pulls the checked genes into the Search Criteria tab.
- Click the Genes List icon (
- CGAP – Use this directory to identify genes. Before clicking the CGAP icon () you must enter gene symbols in the text box. This link does not pull anything into caIntegrator but does provide information about the gene(s) whose names you entered.
Configuring Query Results Display
You can specify columns for the way you want the search results to display either before or after you run the search. If you run the search directly from the Criteria tab before setting the results type/sorting features, by default only the Subject Identifiers display on the Search Results tab. You can then come back to the Results Type Tab and Sorting Tab to expand the display options and re-run the search, having set the display parameters.
For more information, see 5 - Viewing Query Results.
Results Type Tab
The selection you make on the Results Type tab determines whether caIntegrator displays search results for subject annotation or for genomic data. It filters the search based on the criteria you set on the Criteria tab, whether it is annotation, gene expression or image series data type(s). In other words, if you select annotation criteria on the Criteria tab, but select Genomic on the Results Type tab, the data subset that displays on the Search Results tab is genomic data that is filtered by the annotation criteria you defined on the Criteria tab.
- On the Results Type tab, shown in the following figure, select the Annotation, Copy Number or Genomic radio button to search annotation data. Search criteria are described below.
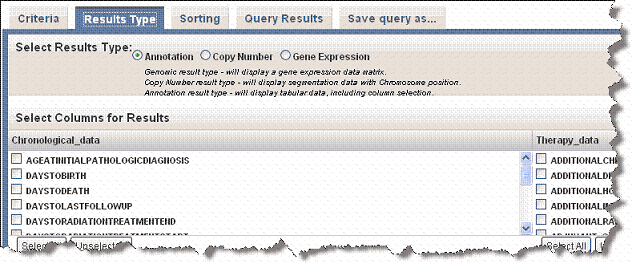
Annotation- Select the annotation elements that you want to display in the search results. All elements listed are column headers in the data uploaded to the study. You can make multiple selections on this list.
Default display
For subject annotations, the Patient or Subject Identifier displays by default in the search results.
Results display as tabular data.- Copy Number - This option appears only if the open study includes copy number data. If you select this option, the annotation elements initially displayed on this tab disappear, and you are asked to run the query again. Based on the criteria you defined, the Query Results tab shows a data matrix containing samples against the genomic region you specified. For more information, see Copy Number Searches and Copy Number Data.
- Gene Expression - Select the Reporter Type and Results Orientation.
- Gene Name – Finds and summarizes at the gene level all reporters that match criteria for the gene you defined on the Criteria tab
- Reporter ID – Finds all reporters that map to the gene(s) you identified on the Criteria tab
- Genes in rows/Subjects in columns or Genes in columns/Subjects in rows – Determines query results matrix format
Results display in a gene expression data matrix. For more information, see Gene Expression Data.
Imaging - If imaging annotations have been added to the study, annotation elements also display on the lower right section of this page when you select Annotation. All elements listed are column headers in the image annotation data uploaded to the study. You can make multiple selections on this list.
Image series IDs display
If you select even one Image Annotation on the Results Type tab, the Image Series IDs display by default in the search results. If you select no Image Annotations on the Results Type tab, however, even if you have selected image series criteria on the Criteria tab, no image series IDs display in the search results. The fact that images can be located, however, in NBIA is indicated by two image-related buttons at the bottom of the Query Results page. You can open the images in NBIA, but they will be at StudyInstance UID level. See Relationship of Subject to Study to Series to Images.
- Use the Select All or Unselect All buttons to aid you in making your selections.
Results display as tabular data. For more information, see Subject Annotation and Imaging Data.
The column selection is saved as part of the query if you save it. See Saving a Query.
Sorting Tab
On the Sorting tab, you can set the sort order for data columns in the query results. You can also indicate whether column contents are sorted in ascending or descending order.
The columns that display on the Sorting tab are those criteria that you selected on the Results Type Tab for an Annotation Results type search.
Tip
Sorting is not applicable to copy number search results. For those results, no options are available on the Sorting tab.
- Select the Sorting tab and indicate the left to right column order of the Search Results by changing one or more numbers in the Column Order column in the table shown in the following figure.
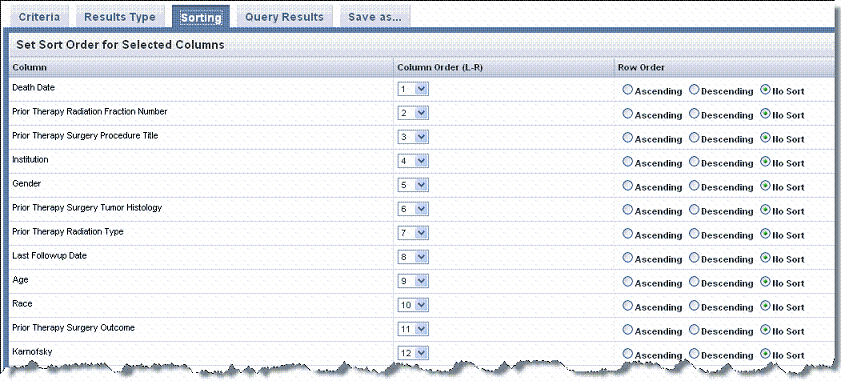
- In the Row Order column, indicate how you want columns sorted, Ascending or Descending, or leave the default, No Sort, if you choose.
- Click Run Query at the bottom of the page to execute your sorting changes in the search results. When you do so, the change in column order is visible on the Query Results tab, as well as on the Sorting tab. For example, any column that you have indicated to be number "1" now appears in Query Results immediately after the Subject Identifier column and at the top of the Set Sort Order table on the Sorting tab.
Sorting parameters are saved as part of the query if you choose to save it using the Save Query feature. See Saving a Query. - If you click the Reset button before running the query from the Sorting tab, the original column settings are restored.
For information about the search results, see 5 - Viewing Query Results.
Managing Queries
When you create a search query in caIntegrator, you can save the query for later use or edit it.
Saving a Query
To save a query, follow these steps:
- Click the Save As tab and enter a Search Name and Search Description, unique to the search. Example: Batch ID 6 and female
- Click Save.
Once the query is saved, it is listed by its name under the Study Data > Queries > My Queries in the left sidebar, whenever the study to which the query applies is selected. Click on the saved query in this list to either edit or re-run the query. Click on the query name to retrieve query results. If you hover over the Name text for the query, a pop-up displays the query description.
Editing a Query
To edit a query, follow these steps:
- Select a query in the left sidebar under the Study Data > Queries > My Queries.
- Click the Edit icon (
 ) corresponding to the study.
 - Change the query and display criteria on the Criteria, Columns and Sorting tabs.
- On the Save As tab, check the appropriate options and click Save As. You can use the same name as the original query or modify the name as needed.
Exporting Query Results
After running a search, you can export the result set or a subset as a tab-delimited text file. For more information, see Exporting Data.