This chapter describes search results that caIntegrator returns after queries.
Topics in this chapter include the following:
Query Results Overview
After you launch a search of a caIntegrator study, the system automatically opens the Query Results tab showing the results of your search. If you have not configured the column and sort display parameters before launching the search, by default the tab shows only the subject identifiers and a column that allows you to select each row of the data subset.
To display and/or sort additional data, you must return to the Results Type Tab and/or Sorting Tab to set display parameters, then re-run the search. The new search results will display the additional information, with the columns and data sorted as you specified.
caIntegrator paginates search results into pages of configurable size (default 20) with standard paginated navigation controls. To sort columns by ascending or descending parameters for on any displayed field, click on the underlined column header.
The query results that can display depend upon the criteria you established for the search. Follow the links below for more information about the category of data you searched.
You can download search results as a CSV file. The file contains the annotations, columns and data sort configurations you specified in the search query. See Exporting Data.
See Subject Annotation and Imaging Data Results, Gene Expression Data Results, and Expanding Imaging Data Results.
Subject Annotation and Imaging Data Results
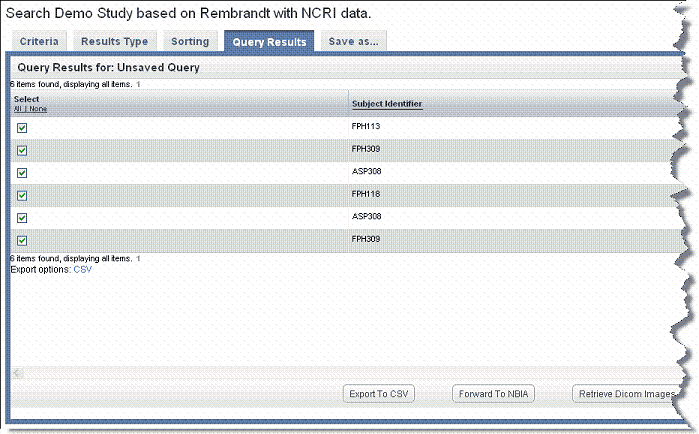
If you run the search before configuring column and sort display parameters, only the [subject] ID that meet the criteria and a column allowing you to select each row appear on the table, as shown in the following figure.
You can add details for one or more subjects by configuring them on the Results Type tab. Annotations listed there are the column headers in the CSV file(s) that were uploaded to the study. For information about using the Results Type tab, see Results Type Tab.
Gene Expression Data Results
If after defining gene expression criteria on the Criteria tab, you select the Gene Expression result type on the Results Type tab, genomic data search results display in a gene expression data matrix. Because the data was downloaded from caArray, the data permissions granted there still apply. In other words, if you have been given access to the data in caArray, you can see it in caIntegrator.
You can select on the Results Type tab a preferred orientation for displaying the results: genes in rows and subjects in columns, or genes in columns and subjects in rows.
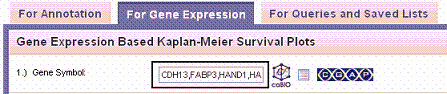
For Gene criteria, caIntegrator finds and summarizes at the gene level all reporters that match criteria for the gene you defined on the Criteria tab. When displaying results at the gene level, the mean is displayed if there are two probes, the median if there is an odd number of probes greater than two and the mean of the two median probes if there is an even number of probes greater than two. Next to each gene symbol, caIntegrator displays an icon ( ) which you can click to open the Cancer Genome Anatomy Project (CGAP) showing data for the gene. Gene symbols and icons are identified in the following figure.
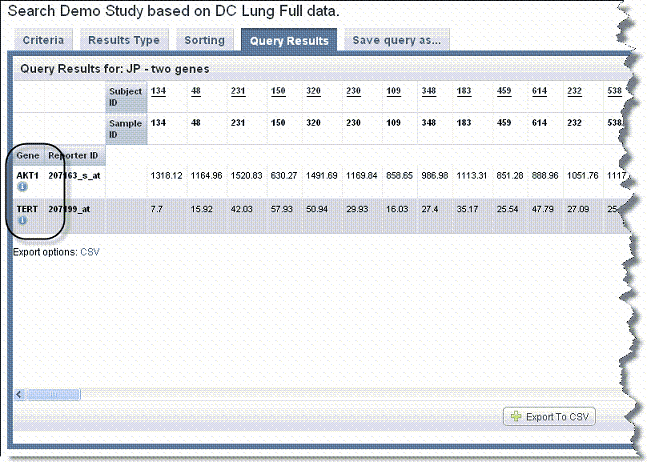
If you have selected Gene Expression on the Results Type tab, then the column headers are a clickable label which sorts the entire table on that column. If you selected Reporter ID on the Results Type tab, the Reporter ID is clickable (and the gene is not clickable).
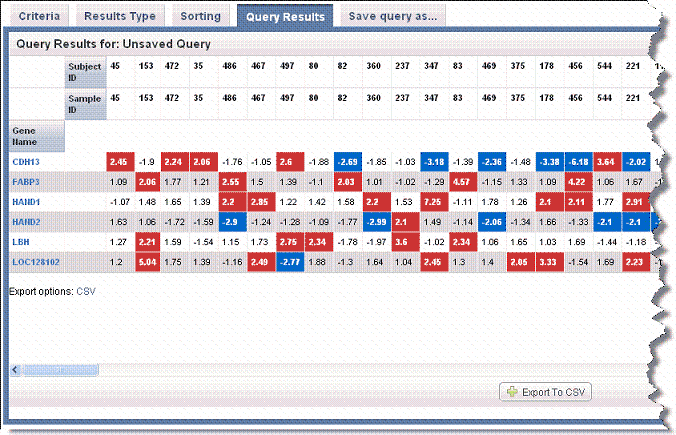
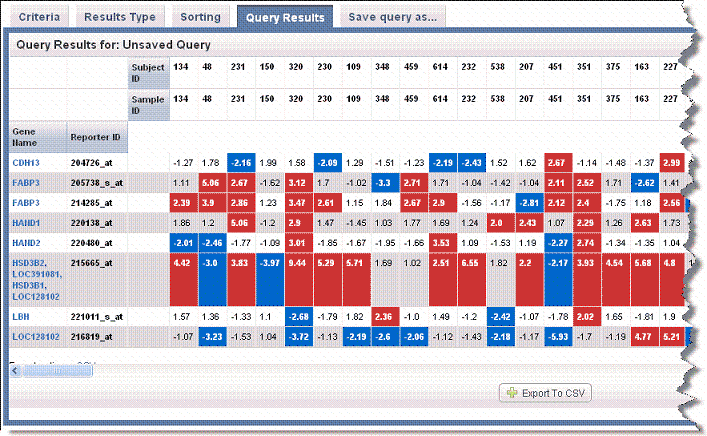
For fold-change criteria, the cells display the normalized signal-based value for a given reporter for a given sample. In the results matrix, caIntegrator highlights matrix values for fold change results that meet fold change criteria. Red represents upregulated values and blue indicates downregulated values. The following two figures display gene name search results with gene reporter type display in the first and reporter ID reporter type display in the second. Note the left hand column in each example.
Gene reporter type display
Reporter ID reporter type display
- Genomic data does not display in tandem with subject annotation and imaging data; it only displays when you select the Gene Expression result type on the Results Type tab. Genomic data is however, filtered by subject annotation and imaging query criteria configured on the Criteria tab.
- Click the Export Options CSV link to download the CSV file whose data displays on the Search Results tab. When you do so, the CSV file opens automatically in MS Excel or similar applications for working with spreadsheets, showing the columns and sorting as you defined them in caIntegrator on the appropriate tabs.
You can save genes identified in the search results as a gene list. For more information, see Creating a Gene or Subject List.
Copy Number Data Results
After defining copy number criteria on the Criteria tab and running a copy number query, you should select the Copy Number result type on the Results Type Tab, and rerun the query. Copy number data search results display in a data matrix containing samples vs. genomic regions.
- Gene symbols display parallel to chromosome regions on the matrix.
- Sample ID column headings display the Subject ID/Sample ID (for example, E09262/E09262) because each calculation is based on a comparison of a tumor and matched blood sample from the same subject.
The values in the Sample ID columns are mean segment values as calculated by the DNAcopy algorithm, shown in the following figure. These are expressed as log2 (test/reference, as in tumor/normal). For more information about the algorithm, see Bioconductor
.
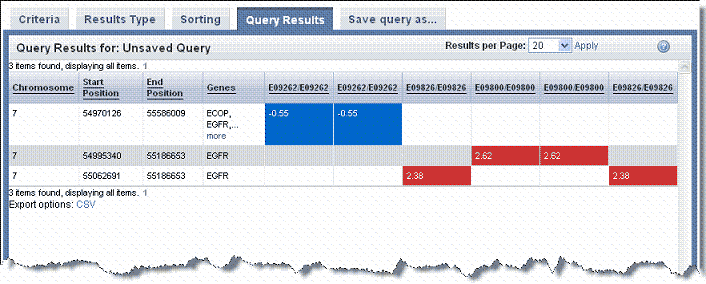
DNAcopy ouput values can be negative. If the test and the reference genomic samples both have two copies of a chromosomal region, the ratio of test/reference is '1', and the log2(1) = 0. That is, if there is no change in the chromosomal structure, then the value is 0. If there are more copies in the test sample (amplification of the chromosomal segment), the ratio of test to reference is greater than 1, and the log2(test/reference) is greater than 0. For example, if the test sample has 6, the ratio or test/reference is 6/2 = 3; log2(3) = 1.58. In a deletion, the test is less than the reference, for example 1. The DNAcopy output value would be log2(1/2) = log2(0.5) = -1.0. Values below -0.6 are often considered a deletion.
Creating a Gene or Subject List
From any page in caIntegrator that shows such a group, you can save a list of genes or subjects so you can use it for searches or analyses. This functionality can also be used where a gene or subject list was created outside of caIntegrator, for example, a list of subjects with validated mutation such as from TCGA projects, or a list of subjects with high EGFR expression or any lists of subjects with genomic or clinical characteristics determined with other tools.
To create a list, follow these steps:
- Click the Create New List link in the left sidebar. This opens the Manage List page, shown in the following figure.
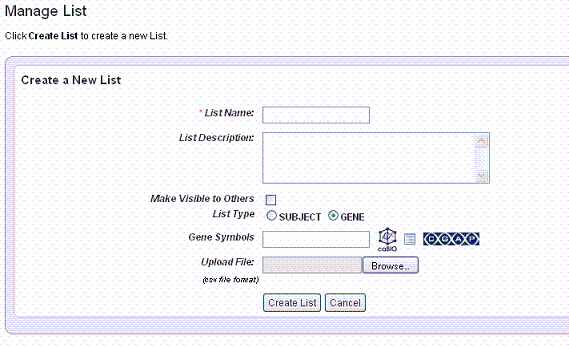
- Enter a name for the gene or subject list.
- Enter a description (optional).
- Select Make Visible to Others if you want the list to be visible to anyone who views the study. This selection places the list in the Global List folder in the left sidebar under Saved Lists. In any box where you can select lists, the term 'Global' will identify any list so identified when the list is created.
- Select the List Type, Subject or Gene.
- If you select Subject, enter the Subject IDs in the text box that appears. Proceed with step 7.
- If you select Gene, proceed with step 6.
- For Gene Symbol, caIntegrator provides three methods whereby you can obtain gene symbols for creating a gene list. For more information, see Choosing Genes.
- If you so choose, you can upload a gene or subject ID list. For the Upload File field, click the Browse button to navigate to a .csv file made up of gene symbols. caIntegrator converts the comma-separated content to a gene list.
- Click Create List at the bottom of the page. caIntegrator now opens the Edit [Subject or Gene] List page which shows the name and symbols of the newest gene list, shown in the following figure.
See Editing a Gene or Subject List for information about the edit feature.
Note
When you perform a GISTIC analysis, caIntegrator automatically saves the retrieved genes in the Saved Copy Number analysis in the left sidebar. For a query or plot analysis, they also appear in the Gene Picker dialog box described in Choosing Genes.
Editing a Gene or Subject List
To view a gene list or subject list in caIntegrator, under Study Data in the left sidebar, click Saved Lists > Global Lists, or My Lists. Select the list/analysis you want to open. The system displays gene or subject lists that have been saved for the open study.
You can initiate the following functions on this page:
- Click on any of the list names or the list icon (
 ) to rerun the query from which the gene or subject list was first created. If the list is a gene list, in the query results, you can click on the gene information icon () to open the Cancer Genome Anatomy Project (CGAP) showing metadata for the gene.
 - Click the edit icon (
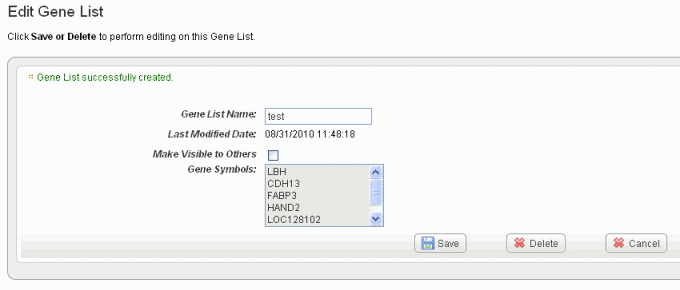
 ) to open an Edit Gene/Subject List dialog box. On this page you can review the list of gene symbols or subject IDs included in the list shown in the following figure.
- In the Edit [List Type] dialog box, you can perform the following tasks:
- To rename the list in the [List Type] List Name text box, enter the new list name.
- You can change the visibility of the list in the appropriate check box.
- To delete the list, click the Delete button.
- Click Save to save your changes or Cancel to leave the page without making changes.
Once a list is created, you cannot edit the list contents.
Choosing Genes
To obtain gene names for a gene expression search or analysis, use one of the following three methods described in this section: bioDBnet, Gene List or CGAP.
- bioDBnet– This link searches bioDBnet for gene IDs, symbols or genes within pathways. Then caIntegrator pulls identified genes into the application for analysis.
- Click bioDBnet.
- Enter Search Terms. Note that caIntegrator can perform a search on a partial HUGO symbol. For example, as search using ACH * would find matches with 'achalasia' and 'arachidonate'.
- Select if you want to search in Gene IDs, Gene Symbols, Gene Aliases, Pathways (from the drop-down list), or Search Pathways for Genes.
- Gene IDs searches the exact gene ID(s) you enter.
- Gene Symbols searches only the Unigene and HUGO gene symbols in bioDBnet.
- Gene Aliases searches for one or more gene symbols which are synonymous for the current gene symbol.
- Pathways searches only the pathway names in bioDBnet.
- Search Pathways for Genes searches for pathways containing gene(s) you specify for the search.
- Select Show only genes that are part of this (caIntegrator) study or Case Sensitive Search if either of these criteria are to be applied to the search. (By default, the search is case insensitive.)
- Choose the Taxon from the drop-down list and click Search. (The Taxon criterion defaults to Human.) The search results display on the same page below the search criteria. The following figure shows search criteria and a few of the listed search results.
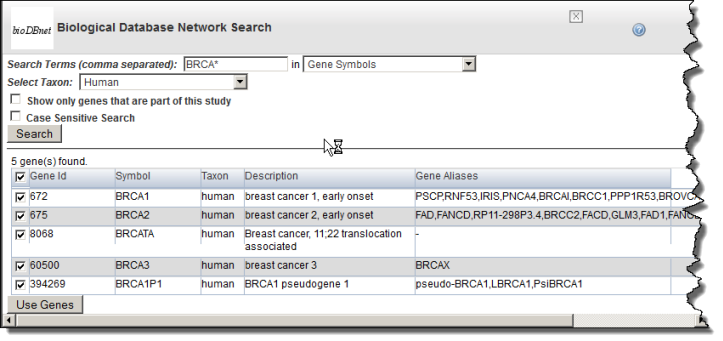
- In the search results, use the check boxes to identify the genes whose symbols you want to use in the gene expression analysis.
- Click Use Genes at the bottom of the page. This pulls the checked genes into the Gene Symbol text box on the Criteria tab. The following figure reveals some of the genes pulled into the Gene Symbol text box.
- Gene List– This link locates gene lists saved in caIntegrator.
- Click the Genes List icon (
 ) to open a Gene List Picker dialog. For more information, see Creating a Gene or Subject List.
If a GISTIC analysis has been run, you may see the following options:- GISTIC Amplified genes is a list of gene symbols in which the corresponding regions of the genome are significantly amplified.
- GISTIC Deleted genes is a list of gene symbols in which the corresponding regions of the genome are significantly deleted.
- In the drop-down menu that lists previously saved gene lists, select a gene list. In the list that appears, use the check boxes to identify the genes whose symbols you want to use in the gene expression analysis.
- Click Use Genes at the bottom of the dialog. This pulls the checked genes into the Search Criteria tab.
- Click the Genes List icon (
- CGAP – Use this directory to identify genes. Before clicking the CGAP icon (
 ) you must enter gene symbols in the text box. This link does not pull anything into caIntegrator but does provide information about the gene(s) whose names you entered.
Viewing Data with the Integrative Genomics Viewer
Once you have run a query for gene expression, or have run analyses for copy number, or analyses for genomic data, you can view results in the Integrative Genomics Viewer (IGV).
The IGV is a high-performance visualization tool for interactive exploration of large, integrated datasets. It supports a wide variety of data types including sequence alignments, microarrays, and genomic annotations.
IGV information
For more information about the Integrative Genomics Viewer or to connect independently to the IGV home page, see Integrative Genomics Viewer .
You may also want to refer to the IGV User Guide
. The IGV viewer and the NCI Heat Map viewer both require you to install a version of Java containing Java Web Start. For more information, see Java for IGV and Heat Map Viewer.
There are two ways to integrate caIntegrator with the IGV. To configure the connection to IGV, follow one of these methods.
Method 1 IGV
- With the appropriate study open, at the bottom of the Query Results page, click the View in Integrative Genomics Viewer button.
- If you click the button at the bottom of the page with any of the query results line items selected, caIntegrator creates IGV files, with a monitor informing you of this. After the files are created, click the Launch Integrative Viewer hypertext link.
- Follow the instructions through the intermediate dialog boxes. After clicking Open with the Java program listed, the
IGV.jnlpopens, displaying the dataset in the computer screen. An example displays in the following figure.
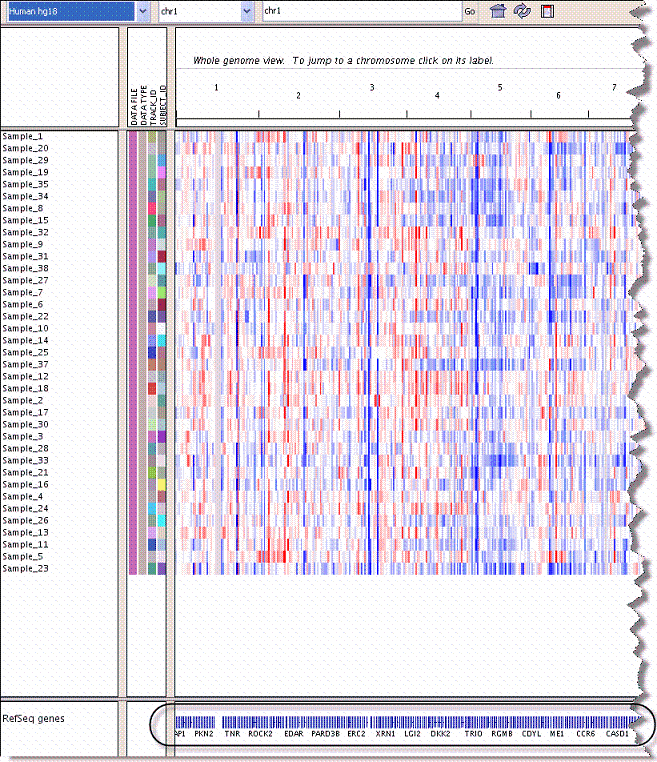
- Move your mouse to hover over the genes graphic at the bottom of the page, indicated in the figure.
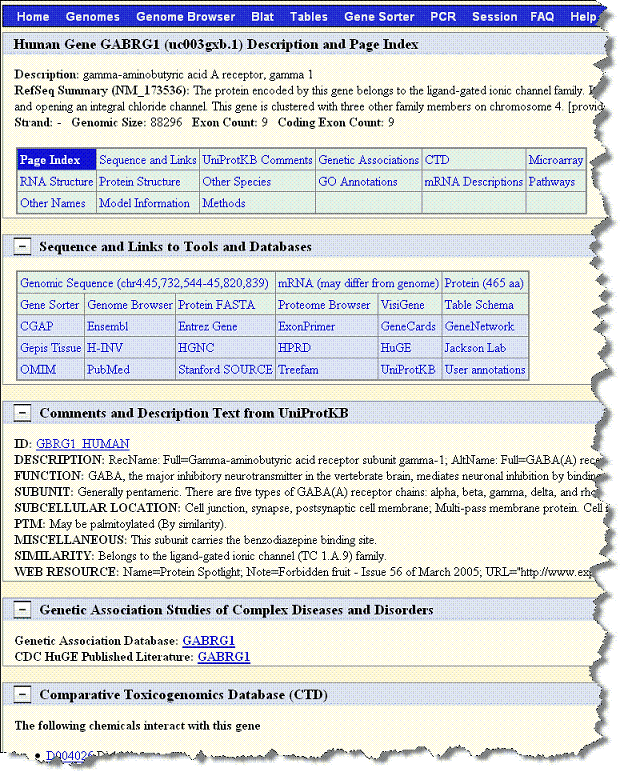
- Click the mouse when you've identified a gene of interest.
This opens the genome site at UCSC, where you can learn more about the gene. The following figures exhibits the kind of metadata you can expect from the UCSC genome site.
Method 2 IGV
- With the appropriate study open, click Integrative Genomics Viewer on the left sidebar. This opens the View IGV Selector page, shown in the following figure.
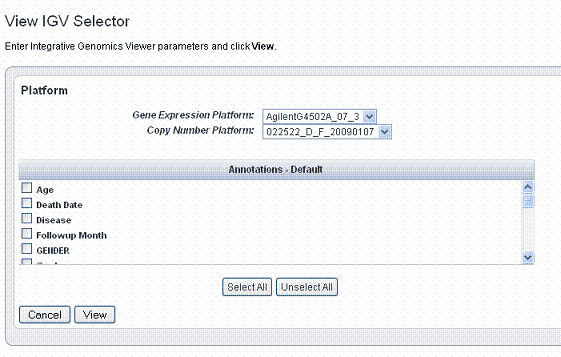
- In the drop-down list, select the Gene Expression Platform for the data you want to view.
- Select the Copy Number Platform ID.
- The Annotations - Default panel displays existing annotation fields for the gene expression data in the open study. Select those fields you want to view when you open the IGV. Use the buttons for convenience if you want to Select All or Unselect All, when all are checked.
- Click View to see the data in the Integrative Genomic Viewer. caIntegrator creates IGV files of the data.
- After the files are created, click the Launch Integrative Viewer hypertext link that appears.
- Continue with Step 3 in Method 1 IGV.
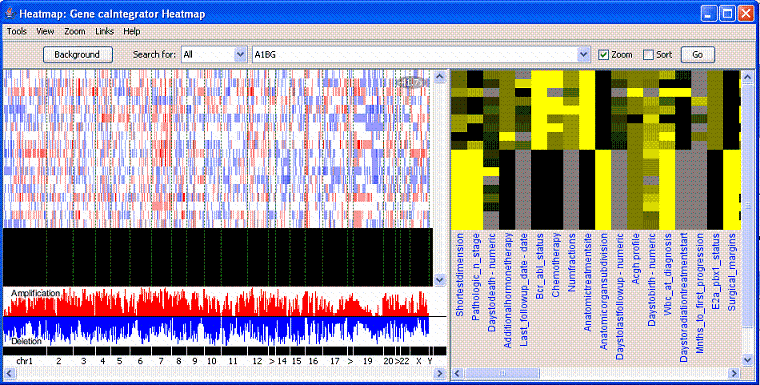
Viewing Data with Heat Map Viewer
Once you have run a query for gene expression, or for copy number, or have run analyses on genomic data, you can view results in the Heat Map Viewer (HMV).
HMV information
For more information about the Heat Map Viewer or to connect independently to the HMV home page, see Heat Map Viewer documentation or HMV documentation. The IGV viewer and the NCI Heat Map viewer both require you to install a version of Java containing Java Web Start. For more information, see Java for IGV and Heat Map Viewer..
There are two ways to integrate caIntegrator with the Heat Map Viewer. To configure the connection, follow one of these methods.
Method 1 HMV
- With the appropriate study open, at the bottom of the Query Results page, click the View in Heat Map Viewer button.
- If you click the button at the bottom of the page with any of the query results line items selected, caIntegrator creates HMV files, with a monitor informing you of this. After the files are created, click the Launch Heat Map Viewer hypertext link.
- Follow the instructions through the intermediate dialog boxes. After clicking Open with the Java program listed, the runs, displaying the dataset in the computer screen. An example displays in the following figure.
Method 2 HMV
- With the appropriate study open, click Heat Map Viewer on the left sidebar. This opens the View Heat Map Viewer Selector page, shown in the following figure.
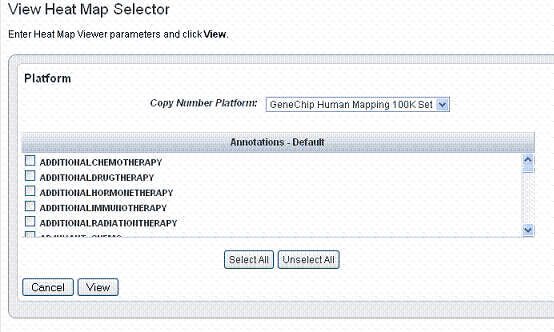
- Select the appropriate Copy Number Platform in the drop down list.
- The Annotations - Default panel displays existing annotation fields for the gene expression data in the open study. Select one or more annotations in the annotation list. For convenience, you can use the Select All or Unselect All buttons.
- Click View to view the data you select in Heat Map Viewer. caIntegrator creates Heat Map Viewer files of the data.
- After the files are created, click the Launch Heat Map Viewer hypertext link that appears.
Continue with Step 3 in Method 1 HMV.
HMV help files
For interpretation of the results and using HMV features, see the help files opened from HMV.
Java for IGV and Heat Map Viewer
To use the IGV and the NCI Heat Map viewer, described in Viewing Data with the Integrative Genomics Viewer and Viewing Data with Heat Map Viewer, you must install a version of Java containing Java Web Start. You must install recent versions of the Java Development Kit (JDK 1.5.0 aka JDK 5.0 or newer) or Java Runtime Environment (JRE 1.5.0 aka JRE 5.0 or newer). The easiest option is to install JRE 5.0
Without Java Web Start, when you click Launch Integrative Genomics Viewer or Launch Heat Map Viewer, a dialog box displays in your browser giving you the option to save or open with igv.jnlp (IGV) or retrieveFile.jnlp (HMV). Clicking the Open option starts the Java Web Start Launcher (default), installing the Java app so that you can view the files.
Upon first launch
The first time you launch the IGV or HMV with Java properly installed, regardless of browser type, a warning may appear: the "the digital signature cannot be verified". Click Run to proceed with opening the viewer.
Expanding Imaging Data Results
In reviewing imaging search results, it is important to understand the hierarchy of submissions in NBIA. For more information, see Relationship of Subject to Study to Series to Images.
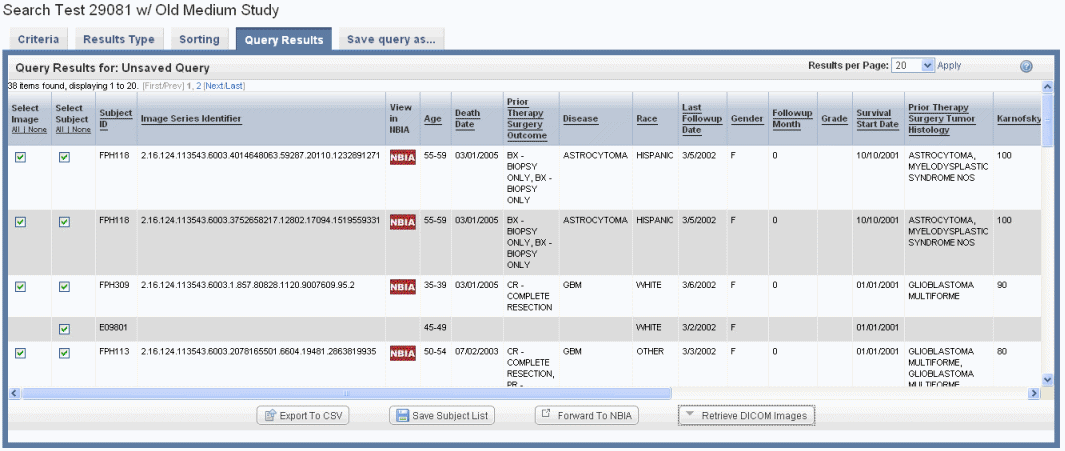
If you run a search before configuring column and sort display parameters, only the Subject Identifiers for the patients/images that meet the criteria and a column containing one check box per row display by default. An example displays in the following figure.
If your annotation choice on the Results Type page identifies annotations such as tumor size or tumor location, the search results display image series subsets that have those annotations, or any annotations you check on the Results Type page. The check boxes work in conjunction with buttons at the bottom of the results page, shown in the following figure. By expanding display parameters, you can view complete details for image search results.
You can add more details for images by configuring image annotations on the Results Type tab. Annotations listed there are the column headers in the image series CSV file(s) that were uploaded to the study. Examples of image details include the following:
- All image details (name, size, etc.)
- The series to which the image belongs
- Image feature attributes
- The subject ID. Click the subject ID under Annotations on the Results Type tab to display this.
You can set display parameters for the results on the Columns and Sorting tabs. For more information, see Results Type Tab.
See also caIntegrator and NBIA, Retrieving DICOM Images and Example of Retrieving Images.
caIntegrator and NBIA
Images can be accessed in NBIA if you see buttons on the Search Results page. See the Imaging Note in Results Type Tab. You can click links on the Search Results tab to view or download image data.
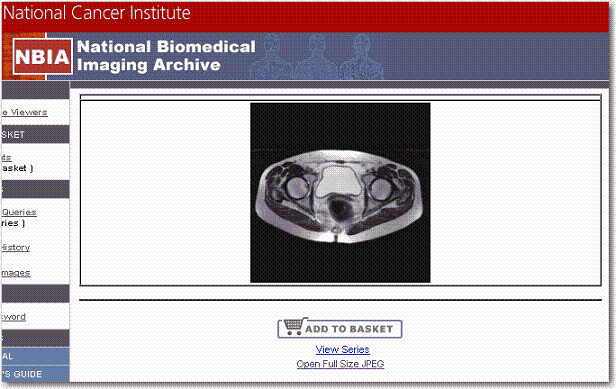
- View in NBIA – This link corresponds to each Image Series listed in the results table. If you click the link, NBIA opens to the login page. After you log in, NBIA brings up the first image in the corresponding image series; an example is shown in the following figure. You must log into NBIA to see the data. On the NBIA page that opens, you can opt to view the entire series containing this image, or you can display the image as a large JPEG-formatted image. You can also add the image to the NBIA basket. For more information, see the NBIA online help or user's guide accessible from NBIA.
- Forward to NBIA – This button is linked to results you have selected by row. Click the button to open NBIA, where the image series you select are loaded in the NBIA image basket. In the event that the caIntegrator study was NOT configured with image annotation for an image series, caIntegrator sends NBIA a list of Study Instance UIDs, for which NBIA will add all corresponding image series to the basket. In the event that the caIntegrator study was configured with annotations for an image series, the system sends NBIA a list of Image Series IDs, for which NBIA adds all corresponding image series to the basket.
Retrieving DICOM Images
On the caIntegrator imaging data Search Results page, you can click the Retrieve DICOM Images button which is linked to results you have selected by row. caIntegrator retrieves the corresponding image(s) from NBIA through the grid. NBIA organizes the download file by patient ID, StudyInstance UID, and ImageSeries UID, and compresses it into a zip file. When caIntegrator notifies you that the file is retrieved, the DICOM Retrieval page indicates whether the retrieved files are Study Instance UIDs or Image Series UIDs, shown in the following figure.
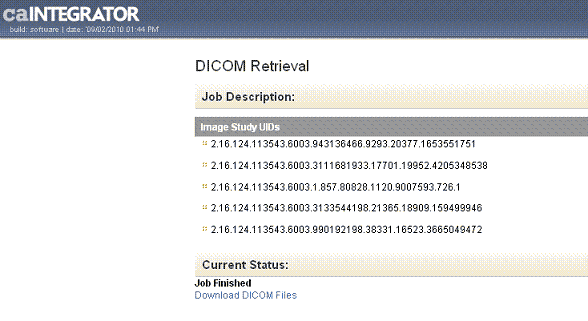
Click the Download DICOM link to download and save the file. caIntegrator unzips the file and displays the list of images in the file. To open the DICOM images, you must have a DICOM image viewer application installed on your computer. For more information about one such viewer, see http://www.e-dicom.com/viewers.php .
In the search results, not all of the subjects in the data subset may be mapped to image series IDs. If you select a mixture of subjects, some of which have image annotations as indicated by an image series ID and some of which do not have image annotations (no image series ID), when you click the Retrieve DICOM Images button, NBIA retrieves the images for the entire NBIA study instance UID that includes the image seriesIDs you checked.
If on the Search Results tab you select only subjects that have image annotations as indicated by an image series ID, when you click the Retrieve DICOM Images button, NBIA retrieves images for the NBIA image series that were matched in the search. If the results are a mixture, but you select one specific row with a valid image annotation, caIntegrator aggregates to the image series. If results are a mixture and you select multiple rows, caIntegrator aggregates to the NBIA study in which multiple image series you have selected in the search results are found.
If your query does not have image annotations and all check boxes are selected, results will go up to image series UID and gives all image series in it. Search results may ultimately depend on how the study was created. For example, if no image series display in query results, it means they were not mapped in the study. In that case, the results "move" up to Study Instance UIDs.
To best understand this, it is important to review the hierarchy of submissions in NBIA. For more information, see Relationship of Subject to Study to Series to Images.
Example of Retrieving Images
If you are searching a study that has image data and image annotation(s) for at least one image series, you would follow these steps:
- Open a study in caIntegrator that has imaging data associated with it that points to the production NBIA server.
- Run a query that will have image series or subjects (patients) who are associated to Image Studies and select a few of those subjects in the check box.
- Click the Retrieve Dicom Images button. Note that it aggregates to the image study.
- Now go back to Results Type tab, select all image annotations and run the query again.
- Select an image series type column and click the Retrieve Dicom Images button. caIntegrator now aggregates to the Image Series that were selected and not the Image Study.
- Select a row that doesn't have image series data, and a row that does, and push the button. This should aggregate to the study for the rows selected.
- Click Forward to NBIA. You should see the same types of aggregation for these tests.
When the image Study is in the checked boxes (regardless of image series being there or not), the system aggregates up to the Image Study level.
Relationship of Subject to Study to Series to Images
This flowchart illustrates the relationship of subject to study to series and lastly to images. In the case of human data, the subject is most likely a patient.

For example, the Study Instance UID is the set of images resulting from one patient office visit. When you upload a spreadsheet of an image series, the hierarchy of images in an image series might look like this:
Study Instance UID (one office visit):
Brain (image series)
- Brain image 1
- Brain image 2
- Brain image 3
Leg (image series)
- Leg image 1
- Leg image 2
- Leg image 3
You can add details for images by configuring image annotations on the Results Type tab. Annotations listed there are the column headers in the image series CSV file(s) that were uploaded to the study. Examples of image details include the following:
- All image details (name, size, etc.)
- The series that the image belongs to
- Image feature attributes
- The subject ID. Click the subject ID under Annotations on the Results Type tab to display this.
Exporting Data
You can choose to download tabular search results as a CSV file. Click the Export .csv link at the bottom of the page. You may need to scroll the page to see it. The file contains the annotations, columns and data sort configurations you specified in the search query.
Note
You will not see the Export option when gene expression data displays as query results.