Page History
...
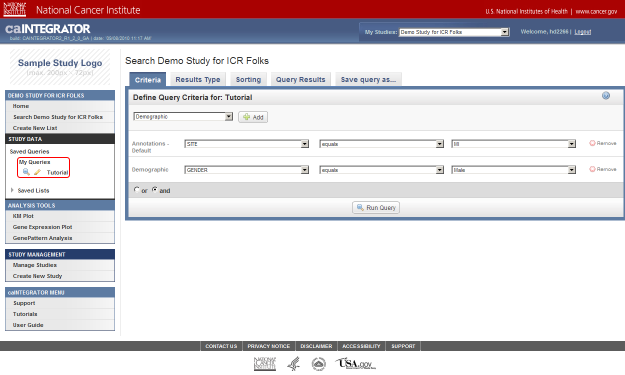
- Now that we've loaded our clinical data into the study, let's query it. To get started, click on the link 'Search Demo Study for ICR Folks' under the menu 'DEMO STUDY FOR ICR FOLKS' in the navigation panel to the left.
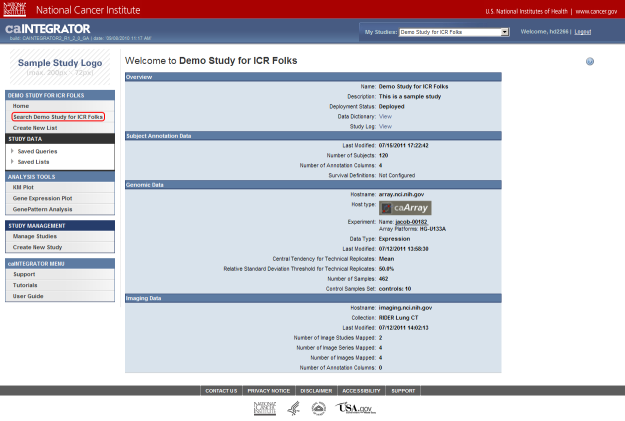
Click on the link 'Search Demo Study for ICR Folks' (highlighted in red) to perform a query on the annotation data you just uploaded.
...
- Next, click on the drop-down list that appears below the 'Add' button. The list contains three items: 'Site', 'Stratagene', and 'Survival in Months'. Click on 'Site'.
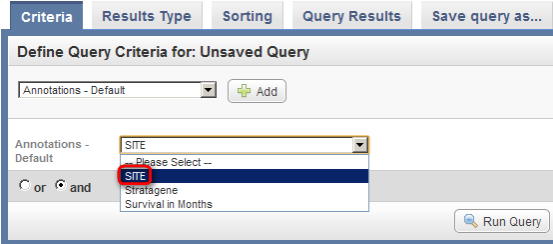
Click on 'Site' (highlighted in red) from the Annotations drop-down list to select it as a query criterion.
- Once you click on 'Site', another two drop-down lists will appear to the right of the original one. Click on the third (rightmost) list to bring up the different values for Site and click on 'MI' from this list.
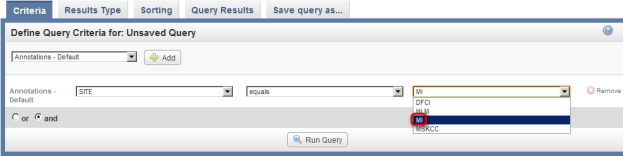
Click on 'MI' (highlighted in red) in the drop-down list of values for the Site field.
...
- Next, a new drop-down list labeled 'Demographic' will appear below the one labeled 'Annotations – Default'. Click on this new list, then click on 'GENDER'.
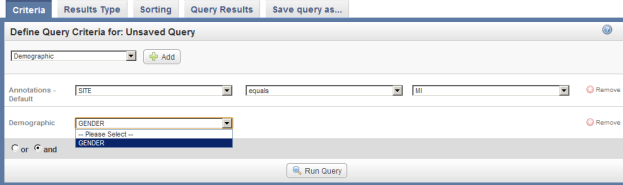
Click on 'GENDER' in the 'Demographic' drop-down list.
- Once you click on 'Gender', another two drop-down lists will appear to the right of the original one. Click on the third (rightmost) list to bring up the different values for Gender and click on 'Male' from this list.
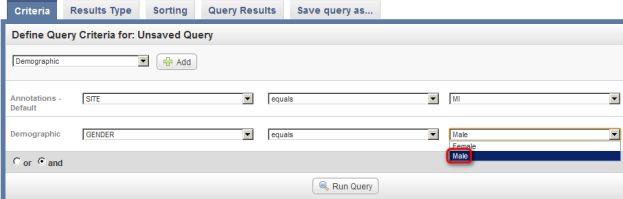
Click on 'Male' (highlighted in red) in the third (rightmost) drop-down list labeled 'Demographic'.
- Now that we've fully defined our query, we're ready to run it. Click on the 'Run Query' button at the bottom of the page to see the results.
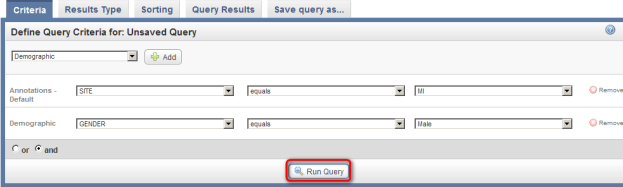
Click on the 'Run Query' button (highlighted in red) to see results.
...
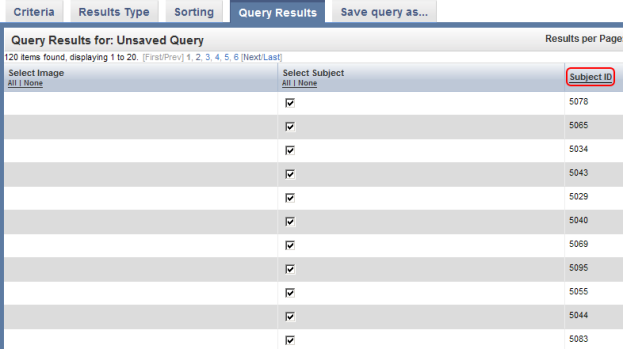
You can sort these results in numerical order of subject ID by clicking on the 'Subject ID' heading above the right table column.
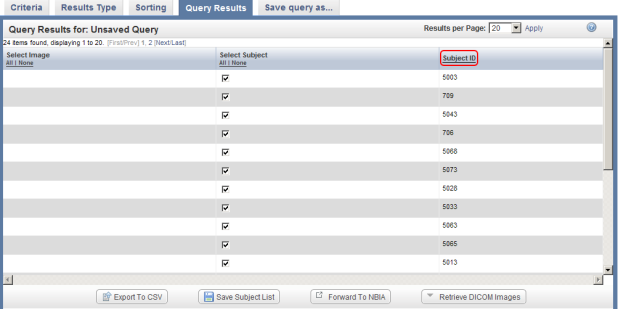
You can sort query results by clicking on the Subject ID heading (highlighted in red) above the right column.
- You can customize the display of query results by clicking on the 'Results Type' tab at the top of the page and selecting additional fields to be displayed via the checklists for each annotation set. In this example, we checked off 'Stratagene' and 'Survival in Months' in the default annotation checklist.
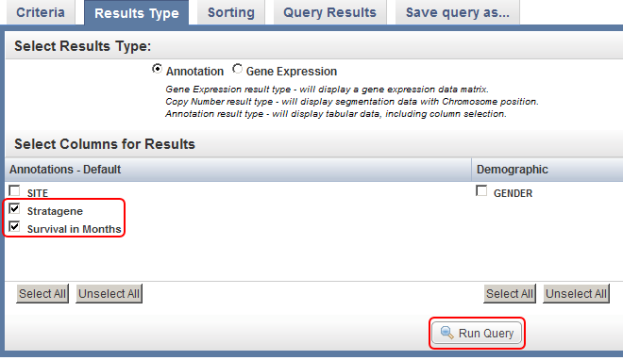
You can select additional fields (highlighted in red) to be displayed in the query results by selecting them from the checklists in the 'Results Type' tab, then clicking on the 'Run Query' button (also highlighted in red).
If you now click on the 'Run Query' button at the bottom right of the page, the results will be displayed again under the 'Query Results' tab, but this time with the additional columns Stratagene and Survival in Months, which correspond to the new fields we selected.
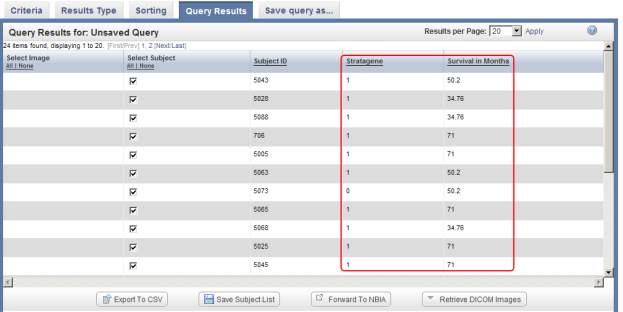
The updated query results include two additional columns (highlighted in red) which correspond to the two additional fields we selected under the 'Results Type' tab.
...
- Once the query is saved, the Search page will reload and the Study Data menu in the left navigation panel will expand to show the newly saved query 'Tutorial' under the 'My Queries' heading. You can click on the magnifying glass icon to the left of the Tutorial link to bring up the query results again, or on the pencil icon to edit the query criteria.
The 'Tutorial' query (highlighted in red) is now saved under the 'STUDY DATA' menu in the left navigation panel and can be accessed at any time.
...
- To begin, navigate back to the 'Edit study' page for the 'Demo Study for ICR Folks'. If you forgot how to do this, you can refer to step 2 in this tutorial.
- On the 'Edit study' page, scroll down to the 'Genomic Data Sources' heading. The table below it shows that one source has already been loaded and mapped. To add another, start by clicking the 'Add New' button to the right of the heading.
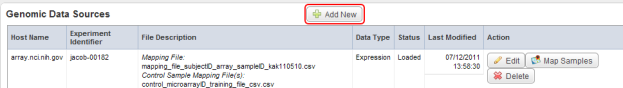
Click on the 'Add New' button (highlighted in red) to begin adding a new genomic data source.
...
- Back on the 'Edit Study' page, a new row has appeared in the 'Genomic Data Sources' table which corresponds to the new data source we just added. Our next step is to map the samples in this source to the subjects in our annotation source. To begin, click on the 'Map Samples' button under the 'Action' column at the right of the table.
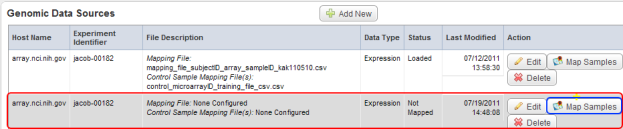
The newly added row (highlighted in red) in the Genomic Data Sources table corresponds to the new genomic data source we added in step 24. Click on the 'Map Samples' button (highlighted in blue) to map the samples to subjects from the annotation source we added in steps 3 to 8.
- The 'Edit Sample Mappings' page displays a list of unmapped samples, followed by another list mapping sample IDs to subject IDs. As you can see, the mapping list is empty, which means that none of the samples in this source have been mapped yet! The list of unmapped samples appears under the heading 'Unmapped Samples' and subheading 'Sample Name'. The numbers in this list represent the sample IDs of the unmapped samples.
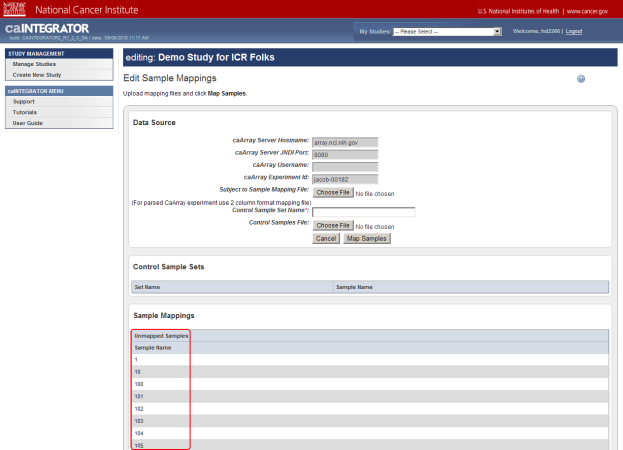
The 'Edit Sample Mappings' page shows a list of IDs for unmapped samples (highlighted in red).
Your mapping CSV file must map the subject IDs in your annotations to the sample IDs in the unmapped samples list. A screenshot of the mapping file used in this tutorial, taken from a Microsoft Excel 2007 window, is shown below. The file is a table of two columns with no headings; the first column contains IDs of the subjects from the annotation source and the second column contains IDs from the unmapped samples list. Each subject in the left column corresponds to the sample in the right column. Note that the file doesn't map every single sample ID from the data source.
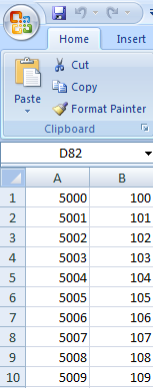
This CSV file maps the subject IDs from our annotation source (left column) to the sample IDs in our genomic source (right column).
To add your mapping CSV file to the study, click on the 'Choose File' button next to the 'Subject to Sample Mapping File' label.
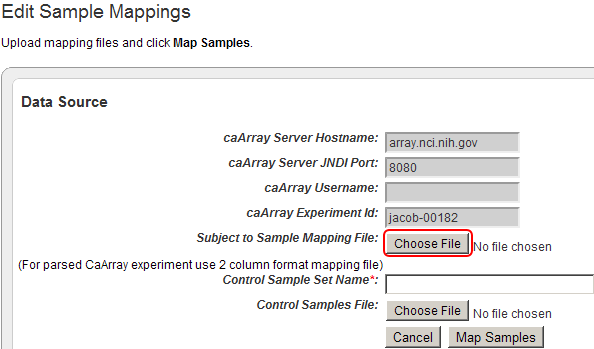
Click on the 'Choose File' button (highlighted in red) to choose a mapping file to open.
...
Since this information may be considered important to your study, we need a way of distinguishing between the cases and controls. The way that caIntegrator addresses this need is with a 'control training file' that lists the sample IDs of all the controls. Any sample that is not listed in this file comes from a case. The screenshot below shows a portion of an example training file in CSV format from a Microsoft Excel 2007 window.
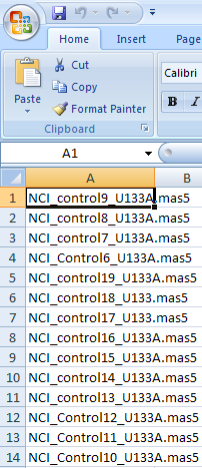
A portion of a control training file listing the sample IDs of all the controls from our example data source. You don't need to understand the format or nomenclature of the sample IDs – they were generated by the instrument or technician who ran the samples.
To add your control training CSV file to the study, click on the 'Choose File' button next to the 'Control Samples File' label.
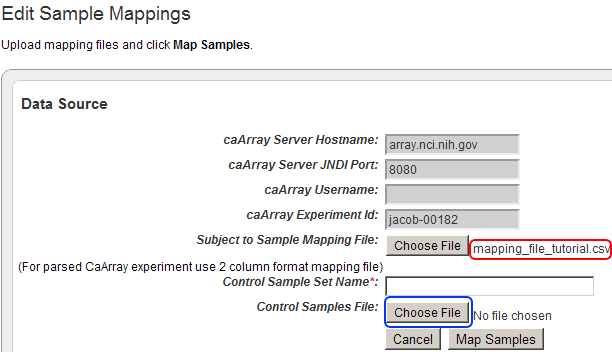
The filename of the mapping file we just uploaded now appears next to the 'Choose File' button for 'Subject to Sample Mapping File' (highlighted in red). Now click on the 'Choose File' button next to 'Control Samples File' (highlighted in blue) to begin uploading your control training file.
...
- On the 'Welcome' page, click on the 'Search Demo Study for ICR Folks' link under the 'DEMO STUDY FOR ICR FOLKS' heading in the navigation panel at the left.
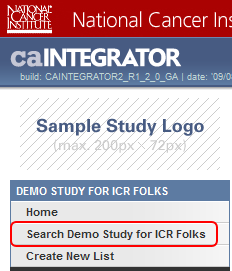
Click on 'Search Demo Study for ICR Folks' (highlighted in red) to begin querying the study.
...
You can sort these results in numerical order of subject ID by clicking on the 'Subject ID' heading above the right table column.
Click on the Subject ID column heading (highlighted in red) to sort the EGFR gene query results.
...
- Once the query is saved, the Search page will reload and the Study Data menu in the left navigation panel will expand to show the newly saved 'Genomic Query' under the 'My Queries' heading. You can click on the magnifying glass icon to the left of the Query link to bring up the query results again, or on the pencil icon to edit the query criteria.
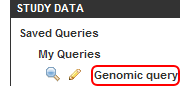
The newly saved 'Genomic query' (highlighted in red) is shown in the 'Study Data' menu under 'My Queries'.
...