Page History
...
| Wiki Markup |
|---|
If you run the search before configuring column and sort display parameters, only the \[subject\] ID that meet the criteria and a column allowing you to select each row appear on the table (). , shown in the following figure. !worddav18596fd9e615cb72d87b2e22d10863d6 !imaging subject ID only80.png|heightvspace=3244,width=561! |
...
alt="Query Results page"! |
You can add details for one or more subjects by configuring them on the Results Type tab. Annotations listed there are the column headers in the CSV file(s) that were uploaded to the study. For information about using the Results Type tab, see on page 60.
...
For Gene criteria, the cells display the median gene expression value for each gene. By each gene symbol, caIntegrator displays an icon (
 ) which you can click to open the Cancer Genome Anatomy Project (CGAP) showing data for the gene ().
...
, shown in the following figure.
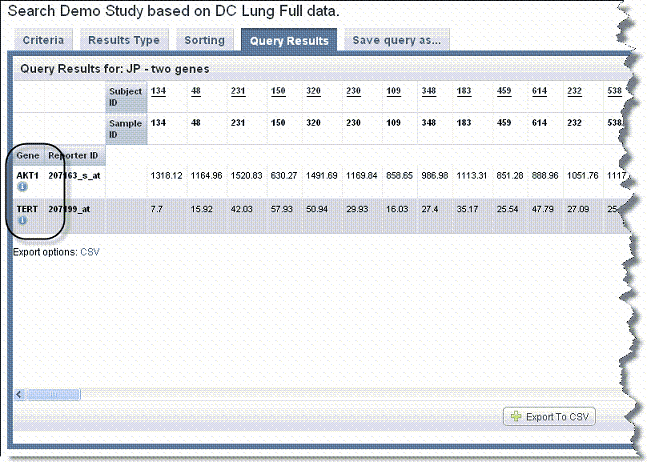
If you have selected Gene Expression on If you have selected Gene Expression on the Results Type tab, then the column headers are a clickable label which sorts the entire table on that column. If you selected Reporter ID on the Results Type tab, the Reporter ID is clickable (and the gene is not clickable).
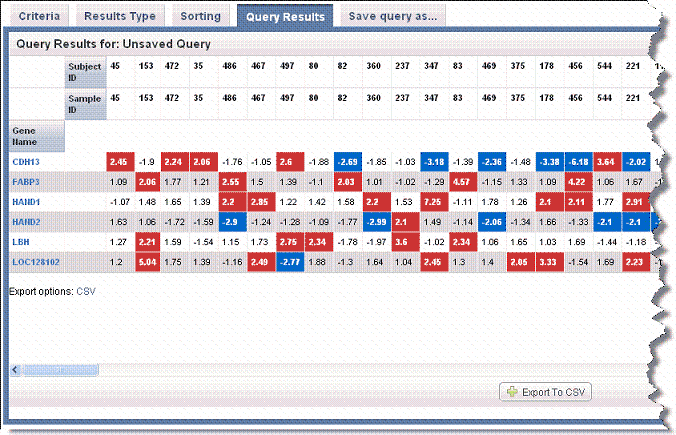
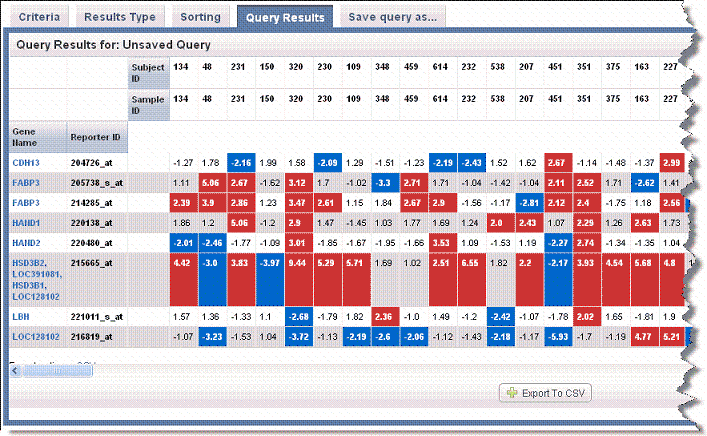
For fold-change criteria, the cells display the normalized signal-based value for a given reporter for a given sample. In the results matrix, caIntegrator highlights matrix values for fold change results that meet fold change criteria. Red represents upregulated values and blue indicates downregulated values. The the following two figures .
...
display gene name search results with gene reporter type display in the first and reporter ID reporter type display in the second.
- Genomic
Anchor RTF36353433343a204361707469 RTF36353433343a204361707469 Gene Name search 6 genes, Reporter Type: Reporter ID. Genes display in rows and subjects appear in columns.Genomic data does not display in tandem with subject annotation and imaging data; it only displays when you select the Gene Expression result type on the Results Type tab. Genomic data is however, filtered by subject annotation and imaging query criteria configured on the Criteria tab.- Click the Export Options CSV link to download the CSV file whose data displays on the Search Results tab. When you do so, the CSV file opens automatically in MS Excel or similar applications for working with spreadsheets, showing the columns and sorting as you defined them in caIntegrator on the appropriate tabs.
You can save genes identified in the search results as a gene list. For more information see .
...
- Gene symbols display parallel to chromosome regions on the matrix.
- Sample ID column headings display the Subject ID/Sample ID (for example, E09262/E09262) because each calculation is based on a comparison of a tumor and matched blood sample from the same subject.
- The values in the Sample ID columns are mean segment values as calculated by the DNAcopy algorithm (), shown in the following figure. These are expressed as log2(test/reference, as in tumor/normal). For more information about the algorithm, see Replace this screen shot Bioconductor.
Anchor RTF34303039303a204361707469 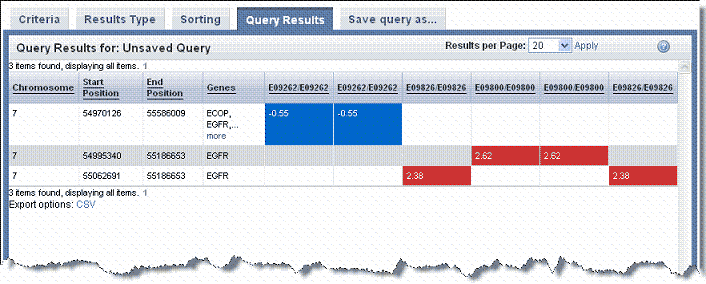
RTF34303039303a204361707469 Data matrix displaying copy number search results
See alsoDNAcopy ouput values can be negative. If the test and the reference genomic samples both have two copies of a chromosomal region, the ratio of test/reference is '1', and the log2(1) = 0. That is, if there is no change in the chromosomal structure, then the value is 0. If there are more copies in the test sample (amplification of the chromosomal segment), the ratio of test to reference is greater than 1, and the log2(test/reference) is greater than 0. For example, if the test sample has 6, the ratio or test/reference is 6/2 = 3; log2(3) = 1.58. In a deletion, the test is less than the reference, for example 1. The DNAcopy output value would be log2(1/2) = log2(0.5) = -1.0. Values below -0.6 are often considered a deletion.
Creating a Gene or Subject List
...
- Click the Create New List link in the left sidebar. This opens the Manage List page ():
...
- , shown in the following figure.
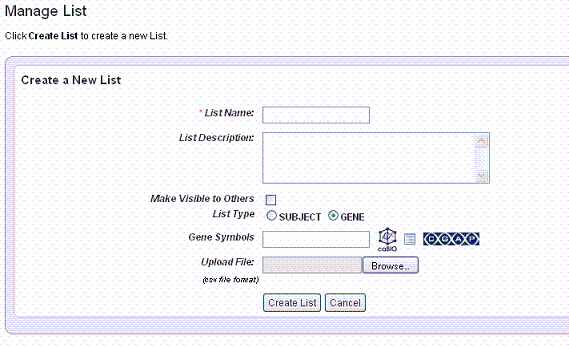
- Enter a name for the gene or subject list.
- Enter a description (optional).
- Select Make Visible to Others if you want the list to be visible to anyone who views the study. This selection places the list in the Global List folder in the left sidebar under Saved Lists. In any box where you can select lists, the term 'Global' will identify any list so identified when the list is created.
...
- For Gene Symbol, enter one or more gene symbols in the text box or click the icons to locate genes in the following databases. If you enter more than one gene in the text box, separate the entries by commas.
caIntegrator provides three methods whereby you can obtain gene symbols for creating a gene list:. For more information, see #Choosing Genes. - If you so choose, you can upload a gene or subject ID list. For the Upload File field, click the Browse button to navigate to a .csv file made up of gene symbols. caIntegrator converts the comma-separated content to a gene list.
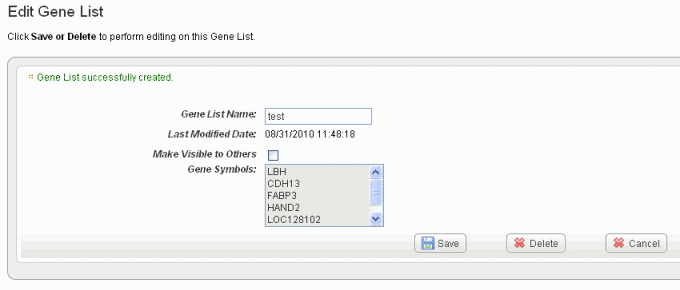
Wiki Markup Click *Create List* at the bottom of the page. caIntegrator now opens the Edit \[Subject or Gene\] List page which shows the name and symbols of the newest gene list (). !worddav62e3e531dc317f07314110e80fe74e23, shown in the following figure. !edit gene list80.png|heightvspace=2214,width=561!
...
alt="The Edit Gene List for reviewing, editing the name or deleting a gene list. The Edit Subject List page is comparable."!
See #Editing a Gene or Subject See Editing a List for information about the edit feature.
...
- Click on any of the list names or the list icon (
) to rerun the query from which the gene or subject list was first created. If the list is a gene list, in the query results, you can click on the gene information icon (
) to open the Cancer Genome Anatomy Project (CGAP) showing metadata for the gene. - Click the edit icon (
 ) to open an Edit Gene/Subject List dialog box. On this page you can review the list of gene symbols or subject IDs included in the list ().
 Anchor RTF39393831313a204361707469 RTF39393831313a204361707469 Edit Gene List allows you to edit gene lists for a studyshown in the following figure.
| Wiki Markup |
|---|
In the Edit \[List Type\] dialog box, you can perform the following tasks: |
...
To view a GISTIC analysis page in caIntegrator where you can review or edit analysis parameters and results, under Study Data in the left sidebar, click Saved Copy Number Analysis. Select the analysis you want to open. The system displays analysis parameters and gene lists that that were retrieved from the analysis ().
...
lists that that were retrieved from the analysis, as shown in the following figure. 
| Tip | ||
|---|---|---|
| ||
In the context of copy number data, 'Amplified genes' refers to a list of gene symbols in which the corresponding regions of the genome are significantly amplified. 'Deleted genes' is a list of gene symbols in which the corresponding regions of the genome are significantly deleted. |
From this page you can rename or delete the analysis.
...
If you run a search before configuring column and sort display parameters, only the Subject Identifiers for the patients/images that meet the criteria and a column containing one check box per row display by default ().
...
. An example displays in the following figure.
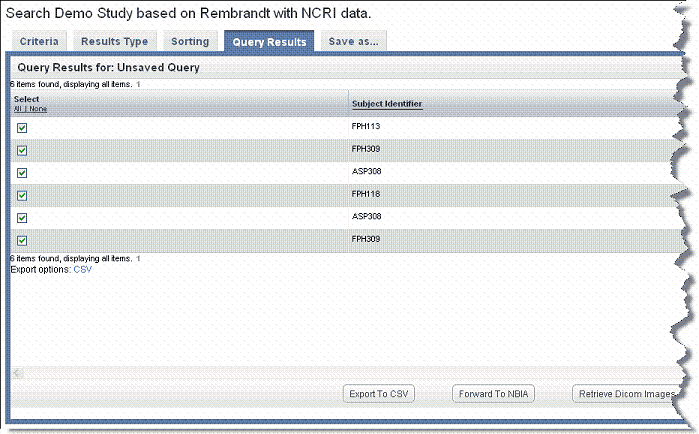
If your annotation choice on the Columns page identifies annotations such as tumor size or tumor location, the search results display image series subsets that have those annotations, or any annotations you check on the Results Type page. The check boxes work in conjunction with buttons at the bottom of the results page ().
...
, shown in the following figure. By expanding display parameters
...
, you can view complete details for image search results.
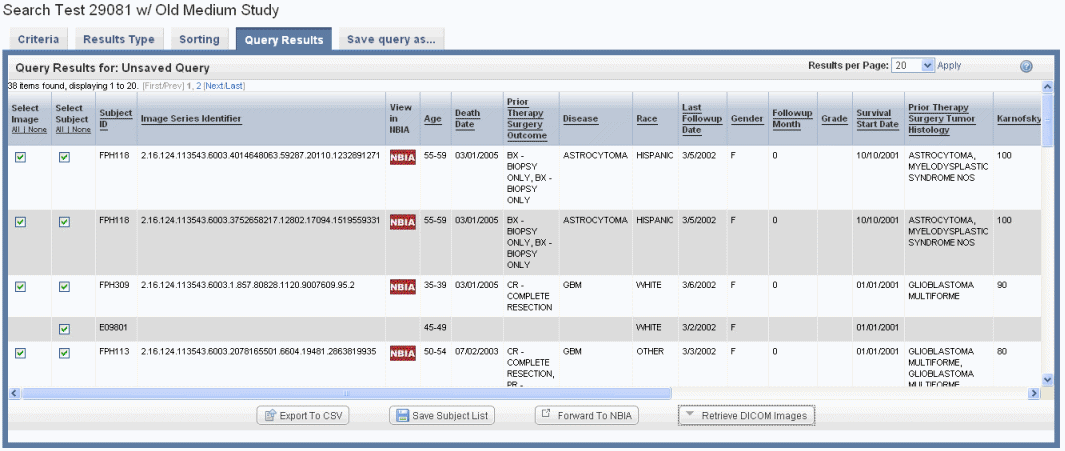
You can add more details for images by configuring image annotations on the Results Type tab. Annotations listed there are the column headers in the image series CSV file(s) that were uploaded to the study. Examples of image details include the following:
...
- View in NBIA – This link corresponds to each Image Series listed in the results table. If you click the link, NBIA opens to the login page. After you log in, NBIA brings up the first image in the corresponding image series (); an example is shown in the following figure. You must log into NBIA to see the data. On the NBIA page that opens, you can opt to view the entire series containing this image, or you can display the image as a large JPEG-formatted image. You can also add the image to the NBIA basket. For more information, see the NBIA online help or user's guide accessible from NBIA.
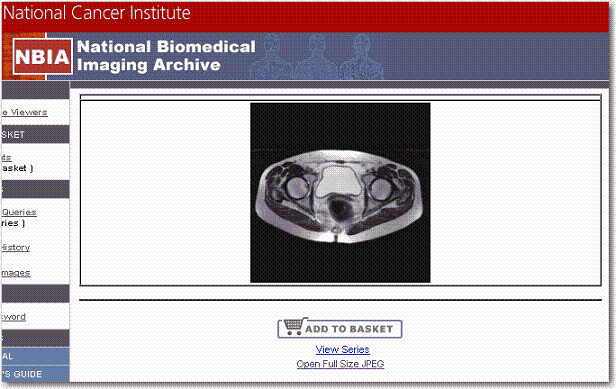
Anchor RTF33343631393a204361707469 RTF33343631393a204361707469 An example of displaying the first image in image seriesForward to NBIA – search results:forwarding imaging results to NBIA;NBIA:forwarding imaging results toThis button is linked to results you have selected by row. Click the button to open NBIA, where the image series you select are loaded in the NBIA image basket. In the event that the caIntegrator study was NOT configured with image annotation for an image series, caIntegrator sends NBIA a list of Study Instance UIDs, for which NBIA will add all corresponding image series to the basket. In the event that the caIntegrator study was configured with annotations for an image series, the system sends NBIA a list of Image Series IDs, for which NBIA adds all corresponding image series to the basket.
...
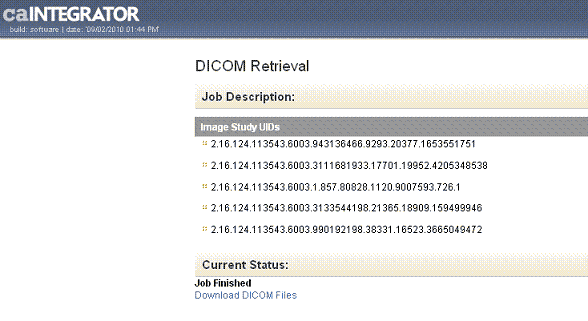
On the Imaging data Search Results page, you can click the Retrieve DICOM Images button which is linked to results you have selected by row. caIntegrator retrieves the corresponding image(s) from NBIA through the grid. NBIA organizes the download file by patient ID, StudyInstance UID, and ImageSeries UID, and compresses it into a zip file. When caIntegrator notifies you that the file is retrieved, the DICOM Retrieval page indicates whether the retrieved files are Study Instance UIDs or Image Series UIDs (), shown in the following figure. For more information, see the note below.
...
...
Click the Download DICOM link to download and save the file. caIntegrator unzips the file and displays the list of images in the file. To open the DICOM images, you must have a DICOM image viewer application installed on your computer. For more information, see .
...