Page History
...
- Click the Load Subject Annotation Source button in the Action section to load the data file you have configured, The Deploy Study button, to this point has been unavailable, but this step activates the button.
Infotip title NoteAdding Files You can add as many files as are necessary for a study. Patients 1-20 in first file, 21-40 in second file, or many patients in first file and annotations in second file, etc. As long as IDs are defined correctly, it works.
- Click Deploy Study. caIntegrator now loads data from the file to the caIntegrator database, and the file status changes to "Loaded".
Infotip title NoteChanging Assignments You can change assignments even after the study is deployed, using the Edit feature. For more information, see #Creating/Editing a Study.
The Manage Studies page opens when the study is deployed. The Deployed status is indicated on the Manage Studies page as well as the Edit Study page. For more information, see #Managing a Study.
You can continue to perform other tasks in caIntegrator while deployment is in process.
See also #Deploying the Study.
...
Adding/Editing Genomic Data
| Info | ||
|---|---|---|
| ||
Genomic data that is parsed and stored in caArray can be analyzed in caIntegrator. Additionally, supplemental files in caArray that have not been parsed can be uploaded and analyzed in caIntegrator. |
...
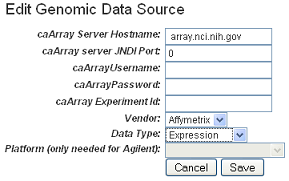
- On the Edit Study page where you have selected and added the subject annotation data, click the Add New button under Genomic Data Sources. You can upload genomic data only from caArray.
This opens the Edit Genomic Data Source dialog box. Enter the appropriate information in the fields, shown in the following figure. The fields are described below.
Field Types
Field Description
caArray Web URL
Enter the URL for the caArray instance to be used for the genomic data sources. This will enable a user to link to the referenced caArray experiment from the study summary page.
caArray Host Name
Enter the hostname for your local installation or for the CBIIT installation of caArray, If you misspell it, you will receive an error message.
caArray JNDI Port
Enter the appropriate server port. See your administrator for more information. Example: For the CBIIT installation of caArray, enter 8080.
caArray Username and caArray Password
If the data is private, you must enter your caArray account user name and password; you must have permissions in caArray for the experiment. If the data is public, you can leave these fields blank.
caArray Experiment ID
Enter the caArray Experiment ID which you know corresponds with the subject annotation data you uploaded. Example: Public experiment "beer-00196" on the CBIIT installation of caArray (array.nci.nih.gov). If you misspell your entry, you will receive an error message.
Vendor
Select either Agilent or Affymetrix.
Data Type
Select Expression or Copy Number.
Platform
If appropriate, select the Agilent or Affymetrix platform.
Info title Note Because you can add more than one set of genomic data to a study, a study can also have multiple platforms, one for each set of genomic data.
Central Tendency for Technical Replicates
If more than one hybridization is found for the reporter, the hybridizations will be represented by this method.
Indicate if technical replicates have high statistical variability
If more than one hybridization is found, checking this box will display a ** in the genomic search results when a reporter value has high statistical variability.
Standard Deviation Type
When the checkbox for indicating if technical replicates have high statistical variability is checked, this parameter becomes available. Select in the drop-down the calculation to be used to determine whether or not to display a ** (see previous bullet point).
- Relative{*}, which --calculates the Relative Standard Deviation in percentage value
- Normal{*}, which --calculates the Standard Deviation in numeric value|
Standard Deviation Threshold
When the checkbox for indicating if technical replicates have high statistical variability is checked, this parameter becomes available. This is the threshold at which the Standard Deviation Type is exceeded and the reporter is marked with a **.
...
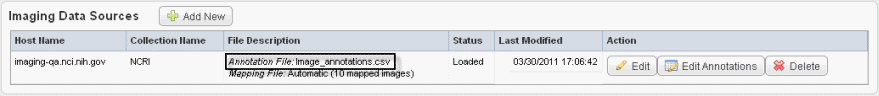
- Click Save to upload the data from NBIA to caIntegrator. The imaging data displays on the Edit Study page under the Imaging Data Sources section, as shown in the following figure.
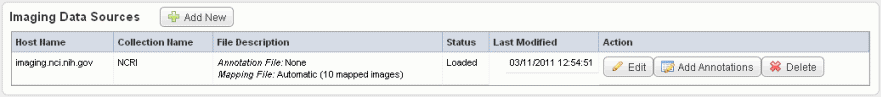
- Once the data is uploaded, you can add image annotations. For more information, see #Adding or Editing Image Annotations.
...
| Tip | ||
|---|---|---|
| ||
The image data shown in the Imaging Data Sources section indicate whether or not annotations have already been imported from a file for these sources. See the marked area in the following figure. |
To add image annotations from a file, follow these steps:
...
- On the left sidebar, click Manage Studies. The Manage Studies page appears, shown in the following figure.

All of the "in process" or "completed" studies display on this page with associated metadata. Note that whoever edited or updated the study last is shown in the Last Modified Column, indicated as the Study Manager. - Click the Edit link corresponding to your study of choice to open the Edit Studies page, shown in the following figure.

On this page you can edit any details such as adding or deleting files, survival values, and so forth. For information about working with the Edit Study feature, see #Creating/Editing a Study. - Click the Delete link to delete the corresponding study.
Managing Platforms
Integrator caIntegrator supports a limited number of array platforms, all of which originate from Agilent or Affymetrix. While they do not represent all of the platforms supported by caArray, caIntegrator must have array definitions loaded for the platforms it supports, and be able to properly load the data from caArray and parse it.
...