This chapter describes the processes for creating and managing studies in caIntegrator. Topics in this chapter include:
Creating a Study – Overview
You can create a caIntegrator study by importing subject annotation study data, genomics data and imaging data You can incorporate a combination of spreadsheets/files and existing caGrid applications as source data. Each instance of caIntegrator can support multiple studies. As the manager creating a study, it is important that you understand the study well and that the data you wish to aggregate has been submitted to the applications whose data can be integrated in caIntegrator.
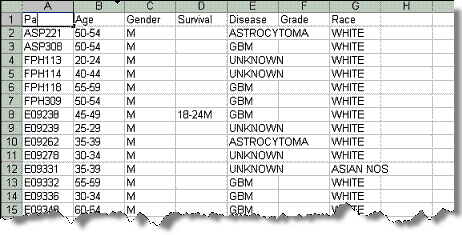
- Subject Annotation – Subject annotation data refers to pre-subject annotation, phenotypic, subject annotation, pathology or any other annotations associated with a subject.The subject annotation data should be available in CSV files, with a unique subject identifier in one column, one subject per row. Note that if you are using human data, the subject will probably be a "patient". Other relevant data can be supplied in other columns to be identified as annotations in the file from within caIntegrator. You, as the study creator, must have access to the subject annotation data file, as the file does not come from a caBIG^®^ repository.
- Genomic – To use caIntegrator to integrate array data, the data should be imported into caArray, either locally or in the CBIIT installation, using that system's data file import functionality. You must also have a mapping file in CSV format. This file indicates correlations between array files and the subjects in the subject annotation data files.
- Imaging – Imaging data should have been submitted to the NBIA grid node as public data, either locally or as part of the CBIIT NBIA installation. Image annotations, which include information about images provided by radiologists or other researchers can include such information as tumor size, tumor location, etc. It must be in CSV format, with unique image series IDs in one column (required) and annotation IDs in the second column. caIntegrator can map the images automatically, or alternatively you can upload an image mapping file in CSV format. This file indicates correlations between subject annotation subjects or images in NBIA and subjects in the subject annotation data files.
As you create the study, you define its structure, identifying the data sources and mapping the data between different source data. After the study has been created and deployed, you can perform analyses of the data in the study.
Configuring and Deploying a Study
Role for creating a study
Only a user with a Study Manager role can create a study. For more information, see caIntegrator Roles.
When you create a study, you must specify different data-types (subject annotation, array, image, etc), data sources (caGrid applications – caArray and NBIA) and map the data, (patient to sample, image series, etc.).
To create a new study, follow these steps:
- In the Study Management section of the left sidebar, click Create New Study.
- In the Create New Study dialog box that opens, provide a name and description for the study you are creating.
- Select the checkbox to specify if you want to allow public access to the study.
- Click Save. Click Cancel to close the dialog without creating the study.
When you save the study, an Edit Study page opens where you can add identify data files for your study. See Creating or Editing a Study.
Creating or Editing a Study
The Edit Study page, as shown in the following figure, displays the Name and Description that you entered for a new study, or for an existing study that you are editing.
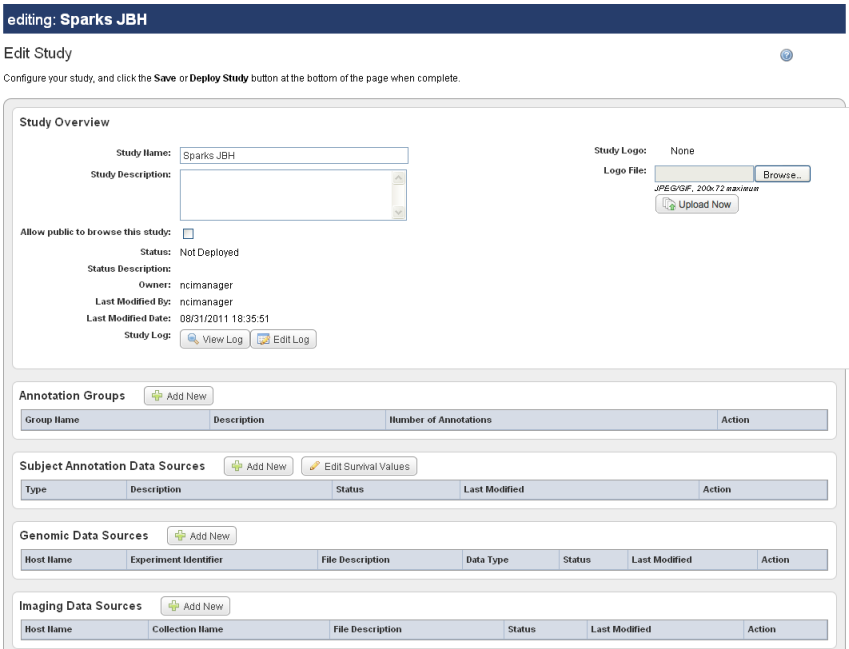
To continue creating a study or to modify a study, complete these steps:
- Enter or change (if editing) the name and/or description.
- Select or verify the checkbox to specify if you want to allow public access to the study.
- For the study log feature, click View Log or Edit Log. See Study Log for details about the log.
Click Save.
Tip
You can save the study at any point in the process of creating it. You can resume the definition and deployment process later.
- If you choose to add a logo for the study, click the Browse button corresponding to Logo File in the upper right of the Edit Study page. Navigate for the file, and click Browse. The file type displays above the Upload Now button.
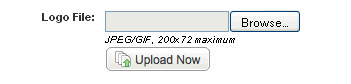
- Click the button to upload the logo. Once you save the study (or its edit), the logo displays in the center of the page. On the home page for the study, the logo displays in the upper left, above the sidebar.
To continue creating the study, you can add subject annotation data sources, genomic data sources or imaging data sources.
Viewing or Editing a Log
On the Edit Study page, as a study manager you can open a detailed log for the study.
- Click View Log on the Edit Study page to simply review an existing log. The log records all steps comprising activity in the study, with the most recent displaying at the top of the log.
- To edit a log, click Edit Log on the Edit Study page.
- Add an appropriate description/annotations to the individual log entries.
- Check the Update box next to the description, then click Save to save the edits. The descriptions will now be available when any user views the log.
See also Study Log.
Working with Annotations
One of the most important tasks in creating a study in caIntegrator is in properly annotating the data. Each annotation has a definition you must identify. Because the process can be quite complex, you might want to review the following steps for working with annotations.
Annotation Workflow Summary
- Add an annotation group. This optional step is for users who have a rigid data dictionary of all annotations relevant to the study. This step can also be helpful in cases where a study has many annotations. For more information, see Adding an Annotation Group.
- Add subject annotation data. This consists of multiple sub-steps.
- Add a new subject annotation data sources file. This step uploads the file containing annotations and starts the workflow for assigning uploaded data definitions. See Editing an Annotation Group, step 1.
- Edit the annotations. This step opens the Define Fields for Subject Data page. See Editing an Annotation Group, step 2.
- In the Define Fields for Subject Data page, review possible definitions in the annotation group associated with this study. See Define Fields Page.
- Assign the visibility of each annotation definition. See Editing an Annotation Group, step 2.
- In the authorization column, select the annotation or annotations to be used to restrict data by subject for authorized groups. If authorization groups are to be used to restrict study data, at least one annotation authorization must be selected. If authorization groups are not to be used to restrict study data, selecting an annotation authorization is not necessary. Annotations used to restrict data by subject must contain permissible values. See Assigning an Identifier or Annotation for more information about permissible values.
- Locate and verify the assignment as "identifier" for one annotation. See Assigning an Identifier or Annotation.
- Review, verify and assign definitions for each annotation. You can do this in one of four ways:
--Accept existing default definitions as described in the associated annotation group. See Assigning an Identifier or Annotation.
--Create or manage definitions manually. See Assigning an Identifier or Annotation.
--Search for and use definitions existing in other caIntegrator studies. See Searching for Annotation Definitions.
--Search for and use definitions from caDSR. See Searching for Annotation Definitions.
- Load the Subject Annotation Source. Up until this point, you can periodically save your work with the annotations, but before you can deploy the study, you must complete this step.
- Deploy the study.
Adding an Annotation Group
Why use this optional step
This optional step is for users who have a rigid data dictionary of all annotations relevant to the study. This step can also be helpful in cases where a study has many annotations.
This topic opens from both the Create Annotation Group page and the Edit Annotation Group page. If you plan to create a group, continue with this topic. If you plan to edit an existing annotation group, see Editing an Annotation Group.
An annotation group is a group of annotation definitions configured in a subject data source CSV file. This feature is primarily meant for the Study Manager who knows that they have tightly restricted vocabulary definitions that are relevant to a study. In this optional step, you can review the uploaded Group Definition Source file before assigning the appropriate definitions for your study.
To add an annotation group, follow these steps:
- On the Edit Study page for a study, Annotation Groups section, click the Add New button.
- On the Edit Annotation Group page that opens, enter a name for the annotation group.
- Enter a description (optional).
- Browse for the Group Definition Source CSV file.
The CSV file must include columns with these column headers in the first row: File Column Name, Field Type, Entity Type, CDE ID, CDE Version, Annotation Def Name, Data Type, Permissible, and Visible. Subsequent rows in the file define each subject annotation column in the subject annotation file.- If a subject annotation is defined by a CDE Public ID, values for the following columns are required: File Column Name, Field Type, Entity Type, CDE ID, and Visible; a value for CDE Version is optional.
OR - If a subject annotation definition is not defined by a CDE Public ID, values for the following columns are required: File Column Name, Field Type, Entity Type, Annotation Def Name, Data Type (String, Date, Numeric), Permissible (Yes or No), and Visible (Yes or No).
- If a subject annotation is defined by a CDE Public ID, values for the following columns are required: File Column Name, Field Type, Entity Type, CDE ID, and Visible; a value for CDE Version is optional.
- Click Save. This uploads the file, whose name now displays on the Edit Study page under Annotation Groups
When you open the Define Fields for Subject Data page, the annotation definitions in the file you uploaded display on the page, available for assignment in the study. Additionally, you can view the definitions by viewing the annotation group listed in the first column of the matrix.
Visibility of annotation definitions
Annotation definitions by default are visible only to the Study Manager's group. They are not visible to all caIntegrator users, unless you change the visibility for each.
Editing an Annotation Group
This topic opens from the Edit Annotation Group page. You may want to refer to Adding an Annotation Group if you are adding a group for the first time.
To edit an annotation group, on the Edit Study page for a study with an existing annotation group, click the Edit Group button.
- You can change the Name and Description for the group.
- A list of annotation definitions applied to the original annotation group displays on the Edit Annotation Group page.
- In the drop-down list, you can select a different annotation group for the annotation definition.
- You can change the visibility for the annotation definition.
- You can change the authorization for the annotation definition. Authorized annotations can be used to restrict data by subject for authorized groups. Annotations used to restrict data by subject must contain permissible data. See Assigning an Identifier or Annotation for more information about permissible values.
- Click Change Assignment to modify the properties of the annotation definition.
- Click Update Annotations to confirm your edits for the group.
Adding Subject Annotation Data
The Edit Study page, described in Creating or Editing a Study, opens after you save a new study or click to edit an existing study.
No manually-created annotation groups?
When following the steps in this section, if you have not manually created Annotation Groups, you MUST check Create a new annotation definition if one is not found.
To add subject annotation metadata on this page, follow these steps:
- In the Subject Annotation Data Sources section of the page, click the Add New button. The page expands to reveal new fields for you to identify information about the annotation data sources.
- Navigate to locate a subject annotation data file which is required for a study. Files must be in CSV file format.
- Click the appropriate box if you want caIntegrator to Create an annotation definition if one is not found.
- Click Upload Now to load the annotation source data.
After the data file is uploaded to this study, it will be listed in the Subject Annotation Data Sources section of the Edit Study page.
From this page you can initiate editing the annotations. In the Subject Annotation Data Sources section, click Edit Annotations corresponding to the subject annotations that have been uploaded for the study. This open the Define Fields Page for Editing Annotations.
Define Fields Page for Editing Annotations
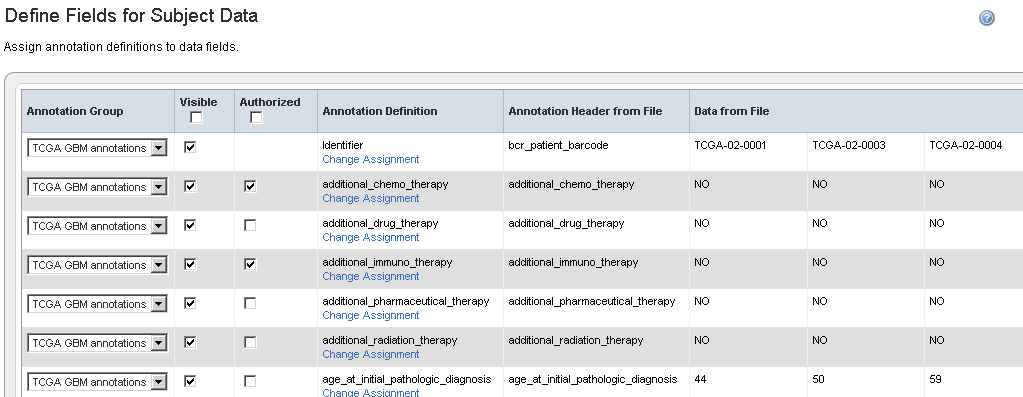
The Define Fields for Subject Data page, shown in the following figure, opens when you click Edit Annotations in the Subject Annotation Data Sources or the Image Data Sources section of the Edit Study page. The exception to this is if you have not yet imported annotations for the imaging data for the study, In that case, when you click the Edit Annotations button in the Imaging Data Sources section, a page opens where you can identify and upload image annotation data. See Adding or Editing Image Annotations.
If this Define Fields page opens after clicking the Edit Annotations button, working with this page is identical for both subject and image annotations
The MOST important steps in creating annotation definitions on this page are these:
- You MUST designate one column in the file as a unique "identifier" column type.
- You MUST review and define column annotation definitions for each column header in the file.
Note the following regarding the list of annotations on this Define Fields... page: - If caIntegrator "recognizes" the same column header in other files already in the system, a term, for example "age" or "survival", which is the current definition, appears in the Annotation Definition column above the blue Change Assignment link on the page.
- When the annotation definition has not been assigned, and the area above the blue Assign Annotation Definition link is blank on this page, no correlating term exists in the database. In this case, you must specify the field type, and then the term will populate the space. See Assigning an Identifier or Annotation for more information.
- A field name that displays in red indicates an error in the annotation. Click the Change Assignment button for more information about the error.
The first column of the table on this page displays annotation groups that have been created for this study. For more information, see Adding an Annotation Group.
To add subject or image annotation metadata in this page, follow these steps:
- You can specify visibility of specified annotation data in the Visiblecolumn.
- Select a checkbox for a row to make the corresponding data visible to all subscribers of the study or anonymous users if the study is made available to the public.
- Clear a checkbox to hide the corresponding annotation from any subscriber or anonymous user of the study. Data continues to exist but does not show up in query fields nor in query results.
- The Annotation Header from File column on the Define Fields for Subject (or Image) Data page (the figure shown above) displays column headers taken from the source CSV file. The Define Fields... page also displays data values in the file you have designated. You must map each column name to an existing column name in the caIntegrator database or in caDSR. If it doesn't yet exist, you would be mapping in caIntegrator in the Define Fields page.
- To indicate the unique identifier of choice, on the row showing the column header (PatientID in the figure, but other examples are subject identifier, sample identifier, etc), click Change Assignment in the Annotation Definition column.
Assigning an Identifier or Annotation
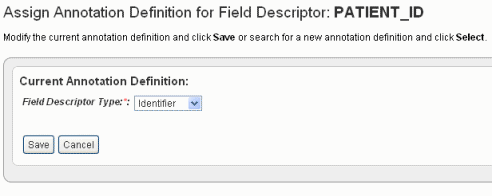
When you click Change Assignment on the Define Fields page, the Assign Annotation Definition for Field Descriptor dialog box opens. On this page you can change the column type and the field definition for the specific data field you selected.
Note
When you change an assignment, you must make sure the data types match--numeric, etc.
- For the column that you choose to be the one and only Identifier column (in this case, PatientID), in the Column Type drop-down list, select Identifier. The following figure shows the dialog box rendering when "identifier" is selected in the Field Descriptor Type drop-down list.
- Click Save to save the identifier. This returns you to the Define Fields for Subject Data page where the Identifier is noted in the Annotation Definition column.
- After you have defined which field is the Identifier, you must ensure that ALL other data fields also have an annotation definition assignment. For those fields without an annotation definition assignment or for those whose annotation definition you want to review, click Change Assignment.
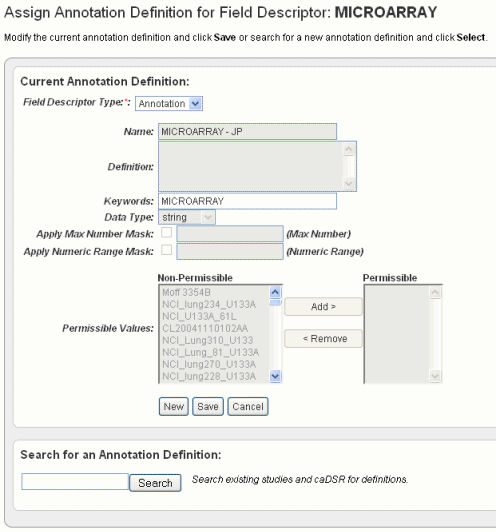
- In the Assign Annotation Definition for Field Descriptor dialog box, shown in the following figure, select Annotation in the drop-down list.
As you select the column type, you can work with column headers in one of four ways in this dialog box.- You can accept existing default definitions (those that are inherent in the data file you selected). See Step 5.
- You can create and/or manage your own definitions manually. See Step 6.
- You can search for and use definitions in other caIntegrator studies. See Searching for Annotation Definitions.
- You can search for and use definitions found in caDSR. See Searching for Annotation Definitions.
- Review the current annotation definition in the Assign Definition page, Current Annotation Definition section. Click Cancel to return to the Define Fields... page.
You can still initiate a search for another annotation definition in the Search for an Annotation Definition section on the browser page if you choose to change the definition. See the bottom section of the preceding figure. See also Searching for Annotation Definitions. Click Save to retain any changes. To enter a new name annotation, or any other information about the annotation definition, click the New button and enter the information described in the following table.
Annotation Field
Field Description
Name
Enter the name for the annotation.
Definition
Enter the term(s) that define the annotation.
Keywords
Insert keyword(s) that could be used to find the annotation in a search, separated by commas.
Data Type
Select a string (default), numeric, or date.
Apply Max Number Mask
This field is available only for numeric-type annotations, or when a new definition is created. This feature is unavailable when permissible values are present.
Select the box and enter a maximum number for the mask, such as "80" for age. When you query results above the value of the mask, then the system displays the mask and not the actual age.Tip
If you enter masks of both "max number" and "range", caIntegrator applies both masks at the same time.
The Data Dictionary page now has a Restrictions column that shows restrictions whenever a mask has been applied.Apply Numeric Range Mask
This field is available only for numeric-type annotations, or when a new definition is created. This feature is unavailable when permissible values are present.
Select the box and enter a width of range for the mask, such as "5" representing blocks of 5 years. For example, if you enter a width of 5, the query only allows age blocks of 0-5, 6-10, 11-15, etc.
When you query results above the value of the mask, then the system displays the mask and not the actual age ranges.Tip
If you enter masks of both "max number" and "range", caIntegrator applies both masks at the same time.
The Data Dictionary page now has a Restrictions column that shows restrictions whenever a mask has been applied.Permissible/Non-permissible Values
Tip
The first time you load a file, before you assign annotation definitions, step #3 in Assigning an Identifier or Annotation, these panels may be blank. If the column header for the data is already "recognizable" by caIntegrator, the system makes a "guess" about the data type and assigns the values to the data type in the newly uploaded file. They will display in the Non-permissible values sections initially. Use the Add and Remove buttons to move the values shown from one list to the other, as appropriate.
Required values
Note that for all annotations you want to appear, you MUST select the Permissible values. To do this, select Change Assignment, as described in step 3 and click the New button on the page that opens. As you are describing each annotation, be sure to add the permissible valudes and move them as described in this table cell. Click Save.
When you select or change annotation definitions by selecting matching definitions (described in Searching for Annotation Definitions), this may add (or change) the list of non-permissible values in this section.
If you leave all values for a field in the Non-permissible panel, then when you do a study search, you can enter free text in the query criteria for this field.
If there are items in the Permissible values list, then the values for this annotation are restricted to only those values. When you perform a study search, you will select from a list of these values when querying this field. If there are no items in the permissible values list then the field is considered free to contain any value.
To edit a field's permissible values, you must change the annotation definition. You can do this even after a study has been deployed.
Editing values in annotation definition?
You cannot edit permissible values in an existing annotation definition. To change permissible values, you must create a new annotation.
Searching for Annotation Definitions
An alternative to creating a new definition is to search for annotation definitions already present in caIntegrator studies or in caDSR.
- Enter search keyword(s) in the Search text box on the Assign Annotation Definition page (the preceding figure). Click Search or click Enter to launch the search. After a few moments, the search results display on the same page. An example of search results is shown in the following figure.
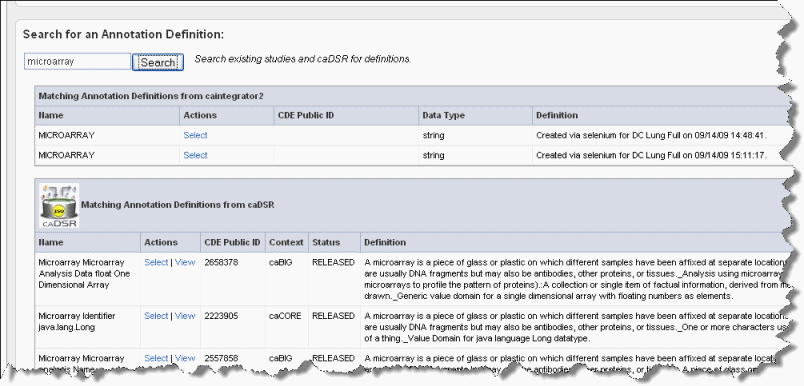
To view the definitions corresponding to any of the "Matching Annotation Definitions", which are those currently found in other caIntegrator studies, click the [term], such as "age", hypertext link. The definition then appears in the Current Annotation Definition segment of the page just above.
In Summary
When you click the link for a definition, that assigns the definition to the Define Fields for Subject Data page, and it also closes the Annotation Definition page. You can modify any portion of the definition, as described in Step 6 in Assigning an Identifier or Annotation.
The matches from caDSR display some of the details of the search results. To view more details of a match, such as permissible values, click View, which opens caDSR to the term. If you click Select, the caDSR definition automatically replaces the annotation definition for this field with which you are working.
Caution
Take care before you add a caDSR definition that it says exactly what you want. caDSR definitions can have minor nuances that require specific and limited applications of their use.
Once you have settled on an appropriate field definition for the annotation, click Save. This returns you to the Define Fields for Subject Datapage.
Note
If you have not clicked Select for alternate definitions in this dialog box, then click Save to return to the Define Field...dialog box without making any definition changes.
From the Define Fields for Subject Data page, be sure and designate the data types for each field in the file. Click Save on each page to save your entries or click New to clear the fields and start again. You will not be able to proceed until every field definition entry on the Fields for Subject Data screen has an entry, one as the unique Identifier and the remainder as annotations.
The Data From File columns on the Define Fields... page display the column header values of the first three rows you designated as "annotations".Tip
Saving your entries in this way saves the study by name and description, but does not deploy the study. See Deploying the Study.
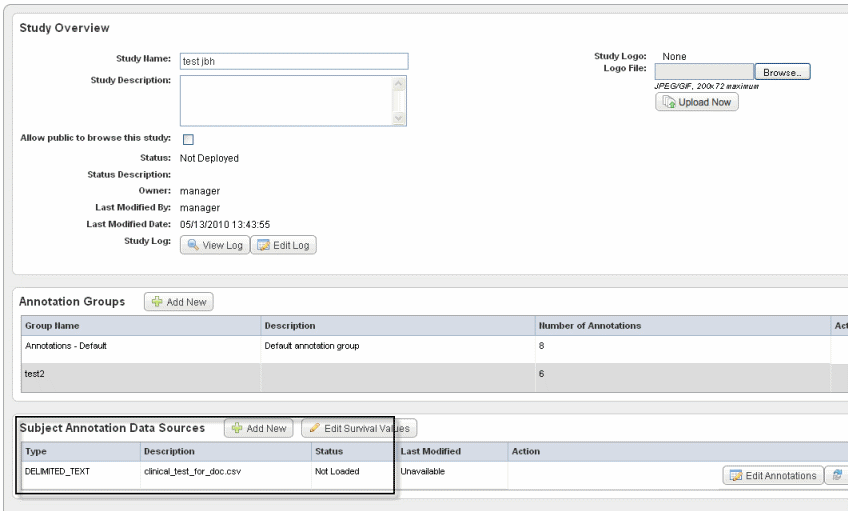
The Edit Study page now displays a "Not Loaded" status for the file whose annotations (column headers) you have defined. An example of a file whose annotations have been defined but not yet loaded is shown in the following figure.
Status definitions:- Definition Incomplete – An annotation definition or definitions must be modified on the Define Fields for Subject Data page. This status may be displayed because an identifier has not been selected. See Define Fields Page for Editing Annotations.
- Not Loaded – The annotation definitions must be loaded before a study can be deployed. If an error appears after attempting to load a subject annotation source, cick the Edit Annotations button which takes you to the Define Fields for Subject Data page where the problematic annotations will appear in red. See Define Fields Page for Editing Annotations.
- Loaded – The annotation definitions are properly loaded.
Click the Load Subject Annotation Source button in the Action section to load the data file you have configured, The Deploy Studybutton, to this point has been unavailable, but this step activates the button.
Adding Files
You can add as many files as are necessary for a study. Patients 1-20 in first file, 21-40 in second file, or many patients in first file and annotations in second file, etc. As long as IDs are defined correctly, it works.
Click Deploy Study. caIntegrator now loads data from the file to the caIntegrator database, and the file status changes to "Loaded".
Changing Assignments
You can change assignments even after the study is deployed, using the Edit feature. For more information, see Creating or Editing a Study.
The Manage Studies page opens when the study is deployed. The Deployed status is indicated on the Manage Studies page as well as the Edit Study page. For more information, see Managing a Study.
You can continue to perform other tasks in caIntegrator while deployment is in process.
See also Deploying the Study.
Uploading later?
You can repeatedly upload additional or updated subject annotations, samples, image data, array data to the study at later intervals. These later imports do not remove any existing data; they instead insert any new subjects or update annotations for existing subjects.
Defining Survival Values
Survival value is the length of time a patient lived. If you plan to analyze your caIntegrator data to create a Kaplan-Meier (K-M) Plot, then during the Annotation Definition process described above in Assigning an Identifier or Annotation, you should do one of two things:
- Make sure that you have defined at least three fields set to the "date" Data Type. These will be matched to the following three properties during Survival Value definition.
- Survival Start Date
- Death Date
- Last Followup Date
- It is also possible to generate KM plots if an Annotation Field Descriptor such as DAYSTODEATH has been set to Data Type 'numeric'. See Assigning an Identifier or Annotation.
Survival values optional
Setting survival values is optional if you do not plan to use the K-M plot analysis feature or if you do not have this kind of data (survival values) in the file.
In caIntegrator, survival values are not pre-defined in the databases when you load the data. However, you can review and define survival value ranges in a data set you are uploading to a study. To be able to do so, you need to understand the kind of data that can comprise the survival values.
To set up survival values, follow these steps:
- On the Edit Study page, click Edit Survival Values. This opens the Survival Value Definitions dialog box, shown in the following figure.
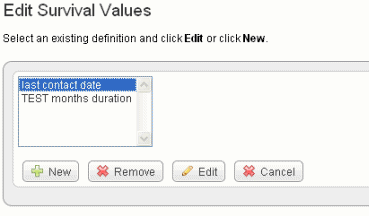
- Click New to enter new survival value definitions.
OR
Click Edit to edit existing survival value definitions.
The dialog box extends, now displaying radio buttons and three drop-down lists that show column headers for date metadata in the spreadsheet you have uploaded. If survival value ranges have already been added to a study, they display on the page. The dialog box is shown in the following figure.
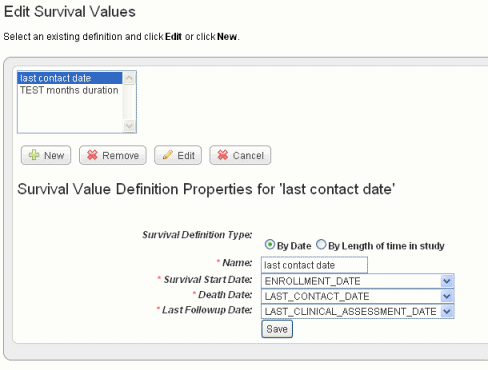
- Survival values can be defined by Date or by Length of time in the study. Select the radio button for the category that defines the data.
In the drop-down lists, select the appropriate survival value definitions for each field listed. You might want to refer to the column headers in the data file itself. Because dates covered by the definitions are already in the data set, you cannot enter specific dates.
Field Type
Description
Survival Definition Type
Select whether the survival time is defined by dates or length of time subject was in the study.
Name
Enter a unique name that adequately describes the survival values you are defining here. Example: Survival from Enrollment Date or Survival from Treatment Start. The name you enter displays later when you are selecting survivals to create the K-M plot.
Survival Length Units
Select the appropriate units for this data.
Survival Start Date
Select the column header for this data.
Death Date
Select the column header for this data.
Last Followup Date
Select the column header for this data.
For data analysis using survival values, see Creating Kaplan-Meier Plots.
Adding or Editing Genomic Data
caArray data
Genomic data that is parsed and stored in caArray can be analyzed in caIntegrator. Additionally, supplemental files in caArray that have not been parsed can be uploaded and analyzed in caIntegrator. caIntegrator refreshes caArray data hourly and displays update status in the Manage Studies page and the Edit Sample Mappings page.
Once you have loaded subject annotation data and identified subject IDs, you can add one or more sets of array genomic sample data from caArray to the study. caIntegrator maps the data by sample IDs to the subject IDs in the subject annotation data, covered in this section, or you can load imaging files from NBIA, also mapped by IDs to the subject data. This is discussed in Working with Imaging Data. You can also edit genomic data information that you have already added to the study. Genomic sample data and imaging data are independent of each other, so neither is required before loading the other.
It is essential that you are well acquainted with the data you are working with--the subject annotation data, and the corresponding array data in caArray.
caIntegrator supports a limited number of array platforms. For more information, see Managing Platforms.
To add genomic data to your caIntegrator study, follow these steps:
On the Edit Study page where you have selected and added the subject annotation data, click the Add New button under Genomic Data Sources. You can upload genomic data only from caArray.
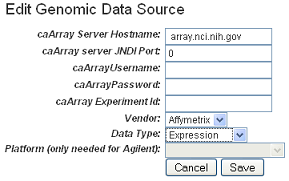
This opens the Edit Genomic Data Source dialog box. Enter the appropriate information in the fields, shown in the following figure and described below.
Field
Description
caArray Web URL
Enter the URL for the caArray instance to be used for the genomic data sources. This will enable a user to link to the referenced caArray experiment from the study summary page.
caArray Host Name
Enter the hostname for your local installation or for the CBIIT installation of caArray. If you misspell it, you will receive an error message.
caArray JNDI Port
Enter the appropriate server port. See your administrator for more information. Example: For the CBIIT installation of caArray, enter 8080 .
caArray Username and caArray Password
If the data is private, you must enter your caArray account user name and password; you must have permissions in caArray for the experiment. If the data is public, you can leave these fields blank.
caArray Experiment ID
Enter the caArray Experiment ID which you know corresponds with the subject annotation data you uploaded. Example: Public experiment "beer-00196" on the CBIIT installation of caArray (array.nci.nih.gov). If you misspell your entry, you will receive an error message.
Vendor
Select either Agilent or Affymetrix.
Data Type
Select Expression or Copy Number.
Platform
If appropriate, select the Agilent or Affymetrix platform.
Multiple platforms
Because you can add more than one set of genomic data to a study, a study can also have multiple platforms, one for each set of genomic data.
Central Tendency for Technical Replicates
If more than one hybridization is found for the reporter, the hybridizations will be represented by this method.
Indicate if technical replicates have high statistical variability
If more than one hybridization is found, checking this box will display a ** in the genomic search results when a reporter value has high statistical variability.
Standard Deviation Type
When the checkbox for indicating if technical replicates have high statistical variability is checked, this parameter becomes available. Select in the drop-down the calculation to be used to determine whether or not to display a ** (see previous bullet point).
--Relative calculates the Relative Standard Deviation in percentage value
--Normal calculates the Standard Deviation in numeric valueStandard Deviation Threshold
When the checkbox for indicating if technical replicates have high statistical variability is checked, this parameter becomes available. This is the threshold at which the Standard Deviation Type is exceeded and the reporter is marked with a **.
- Click Save.
caIntegrator goes to caArray, validates the information you have entered here, finds the experiment and retrieves all the sample IDs in the experiment. Once this finishes, the experiment information displays on the caIntegrator Edit Study page under the Genomic Data Sources section, as shown in the following figure. caIntegrator refreshes carray data on an hourly basis. The status of caArray data updates displays on the Manage Studies page and on the Edit Sample Mappings page.
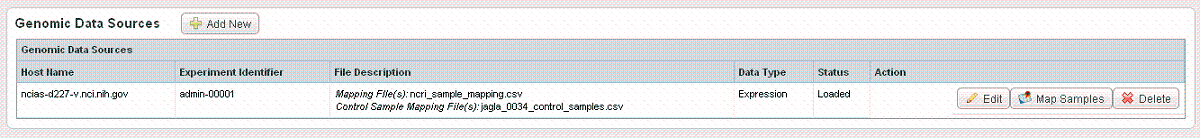
Editing caArray experiment
If you want to redefine the caArray experiment information, you can edit it. Click the Edit link corresponding to the Experiment ID. The Edit Genomic Data Source dialog box reopens, allowing you to edit the information.
Mapping Genomic Data to Subject Annotation Data
Because the goal of caIntegrator is to integrate data from subject annotation, genomic and imaging data sources, data from uploaded source files must be mapped to each other. Mapping files can map to caArray genomic data of two types: "imported and parsed" and that stored in supplemental files.
Creating a Mapping File
You, as the caIntegrator study manager, must create a Subject to Sample mapping file and then import it into caIntegrator before following the actual mapping steps. This file provides caIntegrator with the information for mapping patients to caArray samples.
- If you are starting with parsed data, the mapping file will have 2 columns. If you are working with unparsed data, the mapping file will have 6-column columns. See step 3 below for more information. The six columns that may be part of your file are described as follows:
- All platforms – Raw (level 1) data cannot be mapped; only normalized, processed (level 2) data is acceptable.
- The six-column file format uses the following columns:
- Subject ID
- Sample ID
- Name of supplemental file (if appropriate, as attached to the experiment in caArray)
- Probe Header – Name of column header (in the supplemental file) which contains the probe IDs.
- Value Header – Name of column header (in the supplemental file) which holds the level 2 data.
Sample Header– Name of column header (in the supplemental file) which holds the level 2 data.
Last two columns
Only one of the last 2 columns is used: a single sample per file uses the Value Header column; multiple samples per file used Sample Header column. Unused columns are blank.
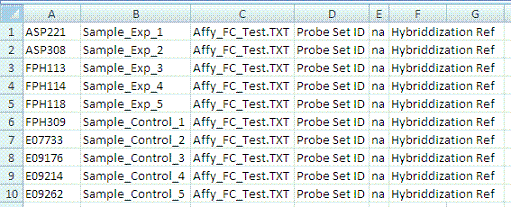
The following figure shows an example multiple sample mapping file in CSV format.
- When you use the mapping file, make sure you use the subject ID for mapping. If the file is human data, the subject ID is the patient ID.
- Determine whether your data from caArray is "imported and parsed" or "supplemental". These are the 'Loading Types' referred to in Step 3 of Steps for Mapping Genomic Data. Fill in the 2-column or 6-column mapping file according to the following standard:
- Imported and parsed – This mapping file for parsed data has only two columns, Subject ID and Sample ID, without a header.
Supplemental– Supplemental files comes in two types: "single sample per file" and "multiple samples per file". In either case, only one of the last two columns is used. If the supplemental data format is single sample per file, the column named "Sample_Header" can be left empty. If the supplemental data format is multiple samples per file, the column named "Value_Header" can be left empty.
Configuring supplemental files
Supplemental files from caArray for mapping data must be configured appropriately. For information, see Supplemental Files Configuration.
The following steps use data of either type.
Steps for Mapping Genomic Data
To map the samples from the caArray experiment to the subjects in the subject annotation data you uploaded, follow these steps:
- On the Edit Study page, click the Map Samples button. This opens the Edit Sample Mappings page, shown in the following figure.
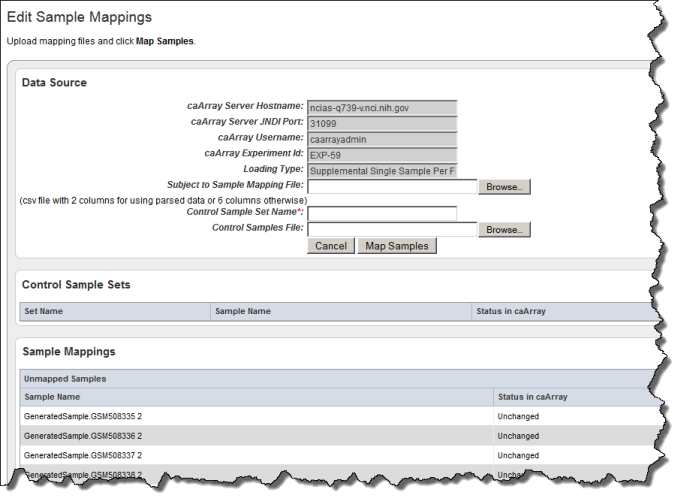
The first two caArray fields may be populated with the information for the instance of caArray to which you have access. You can, however, enter the caArray information described in the following table, if you prefer.
Field
Description
caArray Host Name
Enter the hostname for your local installation or for the CBIIT installation of caArray. If you misspell it, you will receive an error message.
caArray JNDI Port
Enter the appropriate server port. See your administrator for more information. Example: For the CBIIT installation of caArray, enter 8080 .
caArray Username
Enter your caArray account user name and password; you must have permissions in caArray for the experiment if it is private. If the data is public, you can leave this field blank.
caArray Experiment ID
Enter the caArray Experiment ID which you know corresponds with the subject annotation data you uploaded. Example: Public experiment "beer-00196" on the CBIIT installation of caArray (array.nci.nih.gov). If you misspell your entry, you will receive an error message.
- Enter the Loading Type of the data file you plan to map. (File types are described in Creating a Mapping File).
- In the Subject to Sample Mapping File section, click Browse to navigate for the Sample Mapping CSV file that you created (described in Creating a Mapping File). This provides caIntegrator with the information for mapping patients to caArray samples.
- Click the Map Samples button.
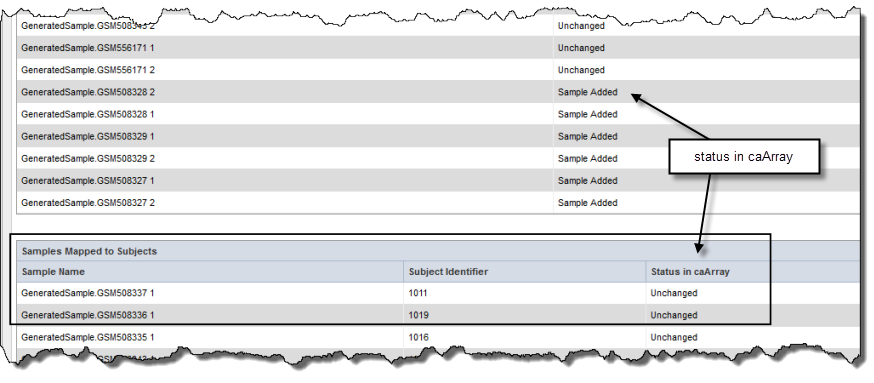
If the caArray data you have identified is imported and parsed, when you click the Map Samples button, the mapping takes place as the data is uploaded into caIntegrator. If the caArray data is supplemental, the mapping does not occur until the study is deployed. Mapped samples are listed in the Samples Mapped to Subjects section; scroll down the page to view them (see the following figure). caIntegrator refreshes caArray data hourly; once samples are mapped, a column on this page displays the status of the data in caArray (noted in the figure). Unmapped samples show at the top of the caIntegrator page. They were loaded from caArray, but they are not in the mapping file. These are not used for integration.
Mapped or unmapped?
If you have already mapped samples, when you first open this page they are listed in the Samples Mapped to Subjects section. If you have not already mapped samples, all of the samples in the caArray experiment you selected are listed as unmapped, because caIntegrator does not know how these sample names correlate to the patient data in the subject annotation file until you upload the subject to sample mapping file.
Uploading Control Samples
A Control Samples file is used to calculate fold change data, which compares "tumor" sample gene expression in the caArray experiment to the control samples to identify those that exhibit up or down gene regulation. Control samples can be the "normal" samples, but that is not always the case.
To upload the control samples, follow these steps:
- On the Edit Sample Mappings page, shown above, click the Map Samples link.
- Click Browse to navigate for the control samples file, and click the Upload Control Samples File button. The control sets display at the top of the page once they have been uploaded, as shown in the following example.
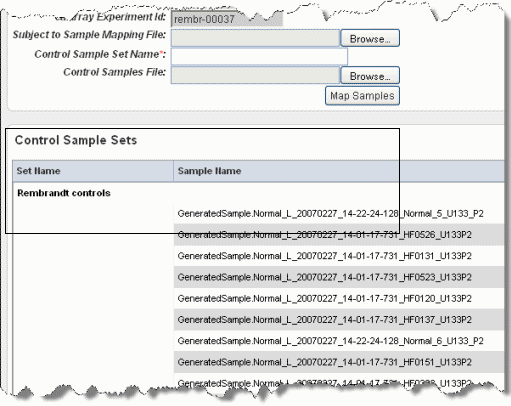
The control samples now display toward the bottom of the page.
This information will be used when performing other tasks in caIntegrator, to be described in other sections.
Composition of control set
If a Control Set is to be used in Gene Expression For Annotation, or Gene Expression Plots for Annotation Query, then the control set should be composed of only samples which are mapped to subjects.
Configuring Copy Number Data
You can add copy number data for a genomic data source by uploading the mapping file. This allows you to configure parameters to be used when segmentation data is being configured.
The name specified in the third column of the mapping file is specific for each array manufacturer:
- Affymetrix – The third column of the mapping file must contain filenames that end in .cnchp. The corresponding experiment in caArray must have these files and the extensions must match .cnchp.
- Agilent – The third column must name a file which contains level 2 copy number data. Level one copy number will not work. This file name is repeated for each line in the mapping file.
To add copy number data relating to the genomic data you are adding, follow these steps:
In the Genomic Data Sources section of the Edit Study page, for the data you have already added, click Configure Copy Number Databutton.
Uploaded copy number data?
This link is available only if you have uploaded copy number data and you are configuring a Copy Number data type (as indicated by the Data Type column on the Edit Study page).
The Edit Copy Number page, shown in the following figure, opens.
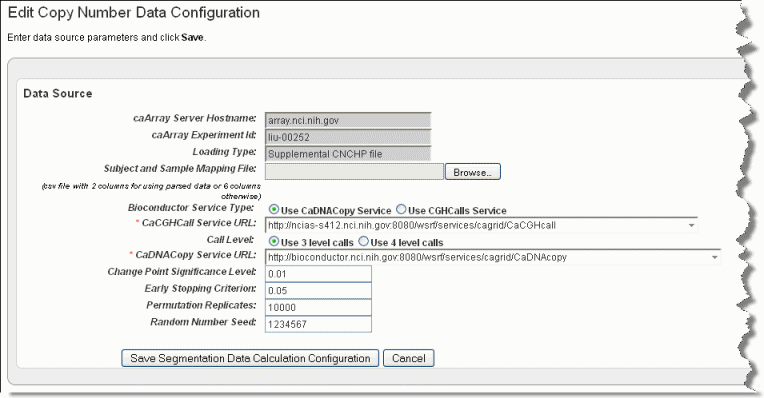
Browse for and enter appropriate information to identify and retrieve the copy number mapping file. The fields are described in the following table. An asterisk indicates a required field.
Field
Description
caArray Service Host Name
Enter the hostname for your local installation or for the CBIIT installation of caArray. If you misspell it, you will receive an error message.
caArray Experiment ID
Enter the caArray Experiment ID which you know corresponds with the copy number data.
Loading Type
Enter the Loading Type of the data file you plan to map.
Subject and Sample Mapping File
Browse for the appropriate CN mapping file. The file must be a CSV file with 3 column format for mapping data files (format: subject id, sample id, file name). Supplemental data uses 6 column-files.
Bioconductor Service Type
This is the type of bioconductor module that will be used for segmentation. Select between the two options: DNAcopy or CGHcall.
caCGHcall Service URL
Enter the URL for the grid segmentation service used to access the caCGHcall service. For more information, see CGHcall
 .
.Call Level
An input parameter to CGHcall. This is the number of discrete values used to represent the copy number level. Select between two options: 3 (consisting of discrete values of -1, 0, 1) or 4 (consisting of discrete values -1, 0, 1, 2)
caDNACopy Service URL
Control for selecting the URL which hosts the caDNACopy grid service. For more information, see DNAcopy
.
Change Point Significance Level
Significance levels for the test to accept change-points
Early Stopping Criterion
The sequential boundary used to stop and declare a change
Permutation Replicates
The number of permutations used for p-value computation
Random Number Seed
The segmentation procedure uses a permutation reference distribution. This should be used if you plan to reproduce the results.
Click Save Segmentation Data Calculation Configurationfor a genomic data source. On the screen upload a copy number mapping file and configure the parameters to be sent when computing segmentation data.
Be Careful
After a study has been deployed and the genomic source has been loaded, you cannot change these copy number parameters without reloading the data from caArray first.
Remapping Copy Number Data in a Deployed Study
Occasionally you may need to remap copy number data in a deployed study. To do so, follow these steps:
- Select the Manage Studies button and select Edit for the study you wish to remap.
- On the Edit Study page, select Edit under the Genomic Data Sources header.
- Without altering any information, select Save. When the warning box appears, select OK.
- Select ConfigureCopyNumberData.
- Enter the new mapping file in the Subject and Sample Mapping File field.
- Select Save Segmentation Data Calculation configuration.
- Select Deploy Study.
Working with Imaging Data
Once you have loaded subject annotation data and identified patient IDs, you can add either array genomic sample data from caArray which caIntegrator maps by sample IDs to the patient IDs in the subject annotation data, or you can upload image data from NBIA, also mapped by IDs to the subject data. Once you have configured an NBIA image data source for adding images, then you can import image annotation data for the images. Genomic sample data and imaging data are independent of each other, so neither is required before loading the other.
It is essential that you are well acquainted with the data you are working with--the subject annotation data, and the corresponding imaging data in NBIA.
Adding or Editing Imaging Data Files from NBIA
To add images from NBIA to the study you are creating, follow these steps:
On the Edit Study page under the Imaging Data Sources section, click the Add Newbutton.
Imaging data source
If you have already provided an imaging data source, it is listed in this section of the Edit Study page. To edit the imaging data source, click the Edit button which opens the same dialog box described in the following steps.
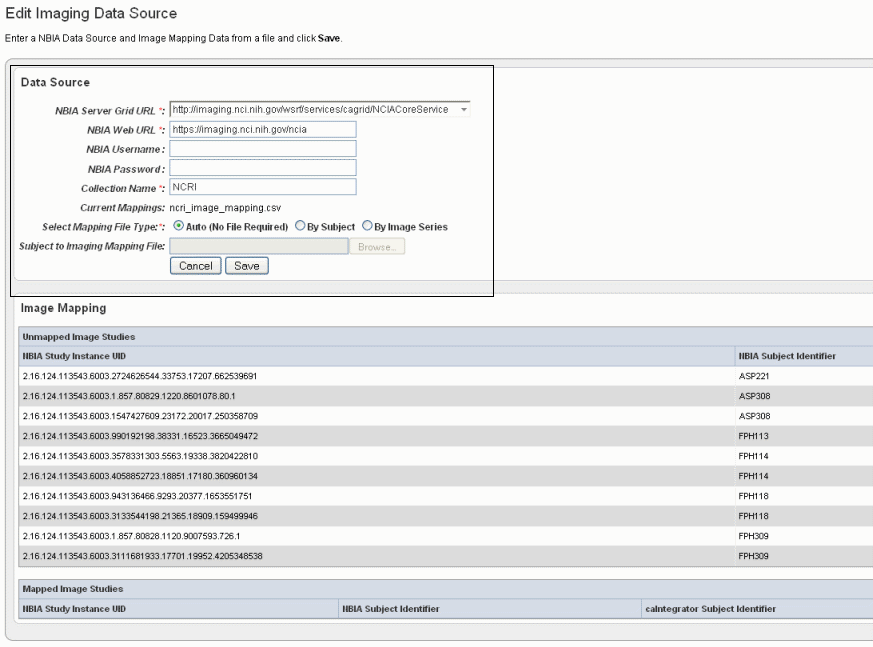
In the Edit Imaging Data Source dialog box, configure the appropriate imaging data source information in the fields as shown in the selected area of the following figure and described below. Fields with an asterisk are required.
Field
Description
NBIA Server Grid URL*
Enter the URL for the grid connection to NBIA.
NBIA Web URL
Enter the URL of the web interface of the NBIA installation.
NBIA Username and NBIA Password
This information is not required, as currently all data in the NBIA grid is Public data.
Collection Name
Enter the name/source for the collection you want to retrieve.
Current Mapping
If a mapping file has already been uploaded to the study to map imaging data, the file name displays here.
Select Mapping File Type
Click to select the file type:
--Auto – No file is required. Selecting this takes all subject annotation subject IDs and attempts to map them to the corresponding ID in the collection in NBIA. If the ID does not exist in NBIA, then no mapping is made for that ID.
--By Subject – Requires a mapping file to be uploaded. The "subject annotation to imaging mapping file" must be in CSV format with two columns that map the caIntegrator subject annotation subject ID to the NBIA subject ID.
--By Image Series – Requires a file to be uploaded. The subject annotation to imaging mapping file needs to be a two column mapping (CSV) from the caIntegrator subject annotation subject ID to the NBIA study instance UID.Subject to Imaging Mapping File
Click Browse to navigate to the appropriate subject annotation to imaging mapping file. See the Select Mapping File Type* field description.
Mapping files uploaded?
If mapping files have already been uploaded for the data sources you are editing, the Image Mapping tables of the dialog box show the mapping from NBIA Image Series Identifier to caIntegrator Subject Identifier.
- Click Save to upload the data from NBIA to caIntegrator. The imaging data displays on the Edit Study page under the Imaging Data Sources section, as shown in the following figure.
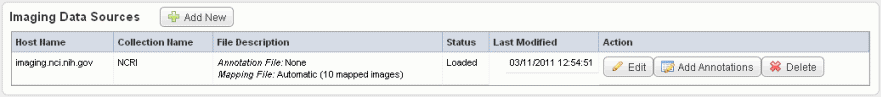
- Once the data is uploaded, you can add image annotations. For more information, see Adding or Editing Image Annotations.
Adding or Editing Image Annotations
After you have configured an image data source with an NBIA Grid service and uploaded the image data, described in Adding or Editing Imaging Data Files from NBIA, you can load image annotations into caIntegrator from a file in CSV format or through an Annotations and Image Markup (AIM) service.
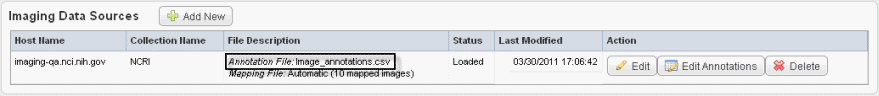
Tip
The image data shown in the Imaging Data Sources section indicate whether or not annotations have already been imported from a file for these sources. See the marked area in the following figure.
To add image annotations from a file, follow these steps:
On the Edit Study page, click the Edit Annotationsbutton under the Image Data Sources section.
Options for this button
If you have not yet imported annotations, clicking this button opens the page from which you can import image annotations, shown in the following figure. Continue with the steps in this section. If you are editing annotations, clicking this button opens the Define Fields for Image Annotations dialog box where you can edit annotations; see Define Fields Page for Editing Annotations.
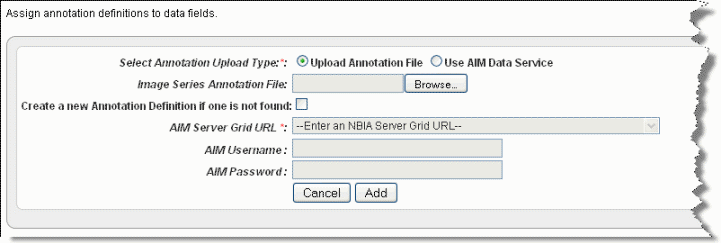
- Select the radio button Upload Annotation File.
Click Browse to select an annotation CSV file for upload.
{{tip:title=Tip} An image annotation CSV file must include an Image Series ID column. See the highlighted column in the following figure.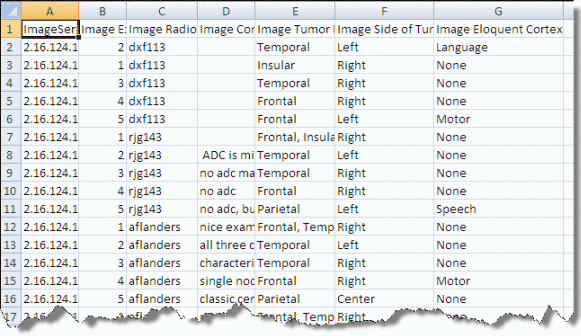
- Check the box for Create a new Annotation Definition if one is not found (if appropriate).
- Click Add.
To load image annotations through an AIM service, follow these steps:
- On the Edit Study page, click the Edit Annotations link under the Image Data Sources section.
- Select the radio button Use AIM Data Service.
- Select an AIM Server Grid URL.
- Click Add.
Using either method, the image annotations are uploaded to caIntegrator. After this occurs, when you click the Edit Annotations button, the system opens to the Define Fields for Imaging Data page where you can edit the annotations. This is the same page (with a customized title) as that described in Define Fields Page for Editing Annotations. You must assign identifiers and annotations to the data in the same way you did with the subject annotation data. For more information, see Assigning an Identifier or Annotation and Searching for Annotation Definitions.
Adding External Links
If you are a study manager, this feature on the Edit Study page allows you to configure a CSV file with URLs to be used as external links relevant to the study. This allows you to easily share or configure references.
To add an external link, follow these steps:
- On the Edit Study page, click the Add button under External Links section. External links can be any URL(s) to resources that are hosted external to caIntegrator but are relevant to the study being deployed.
- Assign a name to the external link.
- Add a description for the link, if appropriate.
- Browse for the CSV file containing URLs (HTTP linked) to resources outside of caIntegrator.
- Click Upload Now. caIntegrator does not validate any links in the file being uploaded.
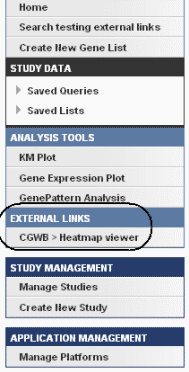
Once you have created external links for a study, when the study is open, an External Links section on the left sidebar of the page shows the link(s). An example is identified in the following figure.
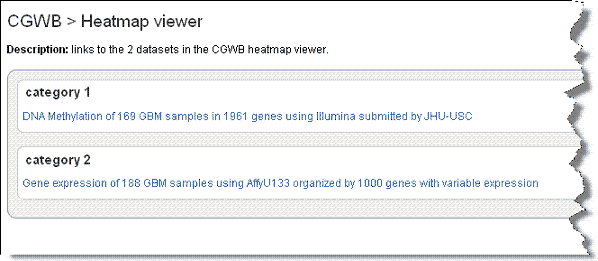
Click an external link to open a page that displays appropriately formatted web page links; an example is shown in the following figure.
Deploying the Study
When you are ready to deploy the study, click the Deploy Study button on the Edit Study page. caIntegrator retrieves the selected data from the data service(s) you defined and makes the study available to a study manager or to anyone else who may want to analyze the study's data. Using the Manage Studies feature, you can then configure and share data queries and data lists with all investigators who access the study.
Note that you can continue to work in caIntegrator while the study is being deployed.