Page History
...
- Select the study to be searched.
- Select one data type:
Wiki Markup *\[Annotations\]* – Annotation data can be labeled 'default' or given the annotation 'group' name when annotation groups are specified by the manager, for example, chronologic, therapy, diagnosis, patient, or other annotation group types. This selection searches one or more uploaded CSV files for data identifiers or annotations (column headers) specified during study creation.
Wiki Markup *\[Genomic\]* – Genomic data can be gene expression or copy number data. This selection searches caArray experiments samples uploaded in the study for gene expression or copy number data by gene name, reporter ID, chromosome number, chromosome coordinates and/or segmentation values representing amplification or deletion.
- Image Data – This selection searches NBIA imaging files uploaded in the study for image annotations or links to images, identified by subject identifiers or image series IDs.
- Define criteria for the search in the selected data type and run the search.
- For a more complex search, select multiple criteria from more than one data type.
- Specify whether you want subject/imaging annotations to display or genomic data to display.
- Review search results.
- Configure results column and sorting display settings. You can do this before or after you run a search. If you choose to do it after, you must re-run the search.
- Download annotation search results as a CSV file. The CSV file contains only the data you specified in the annotation and display configurations.
- Follow links to NBIA in the search results to view or download images located in the search.
Searching a caIntegrator Study
To initiate a search of all annotations and/or other data in a study, follow these steps:
...
For a gene expression search, follow these steps:
For the Gene Expression selection, select #*Gene Name*, #*Expression Level* or #*Fold Change*. Follow the links for descriptions about each selection. Additional search fields will display upon selection. If the study includes multiple platforms, a Platform option is also visible.
...
- Select the range type from the following options:
- >=: Greater than the entered value
- <=: Less than the entered value
- Inside Range: Looks for all matching values that occur between the two levels you enter
- Outside Range: Looks for all matching values that are not in between the two levels that you enter.
The range of possible values is determined on the array side; the value is affected by the array type and the sample's behavior.
- Enter the Expression levelLevel appropriate for your query. The value that you enter is compared to the expression levels that are reported by the probes on the array platform. The probe value is typically a normalized value.This criteria changes slightly based the range type you select.
The default value of 100 is a fixed default and does not reflect any values on the array. It simply represents a starting point for the query. - Continue with step 6 in Searching a caIntegrator Study.
...
| Include Page | ||||
|---|---|---|---|---|
|
Segmentation
...
Search
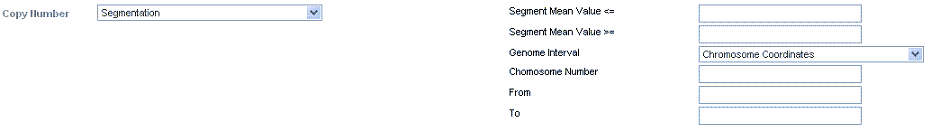
Additional fields display for the Segmentation selection. Segmentation is the process of defining the chromosomal boundaries (coordinates) of the region deleted or amplified in the sample.
- Select or enter data for the copy number query fields shown in the following figure and described below.
 .
.- Segment Mean <= – Enter the value equal to or less than the higher limit of change.
- Segment Mean >= – Enter the value equal to or greater than the lower limit of change.
- Genome Interval > Gene Name – See #Gene Name Search
- Genome Interval > Chromosome Number – In the text box that opens, enter the chromosome number you want the query to search against.
- Genome Interval > Chromosome Coordinates – In the From and To text boxes that open, enter the range on the chromosome you want to search. This defines the chromosomal boundaries of the region with the suspected copy number variations.
- Segment Mean <= – Enter the value equal to or less than the higher limit of change.
...
Continue with step 6 in Searching a caIntegrator Study.
CGH Calls CGHCalls Searches
Additional fields display for the Calls selection. CGHCalls calls aberrations for array CGH data using a six state mixture model.
- Select or enter data for the copy number query fields shown in the following figure and described below.
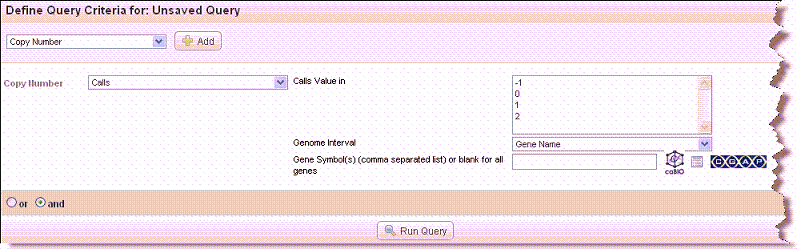
- Copy Number values: Select one or more of the Calls values. Values are -1 (loss), 0 (normal) or 1, (gain). If four levels were used for calling, a value of 2 represents an amplification.
- Genome Interval > Gene Name – See #Gene Names Search.
- Genome Interval > Chromosome Number – In the text box that opens, enter the chromosome number you want the query to search against.
- Genome Interval > Chromosome Coordinates – In the From and To text boxes that open, enter the range on the chromosome you want to search. This defines the chromosomal boundaries of the region with the suspected copy number variations.
For more information about CGHCalls, see CGHcalls.
- Continue with step 6 in Searching a caIntegrator Study.
Include Page caIntegrator:Choosing Genes caIntegrator:Choosing Genes
...
- On the Results Type tab, shown in the following figure, select the Annotation, Copy Number or Genomic radio button to search annotation data. Search criteria are described in the following tablebelow.
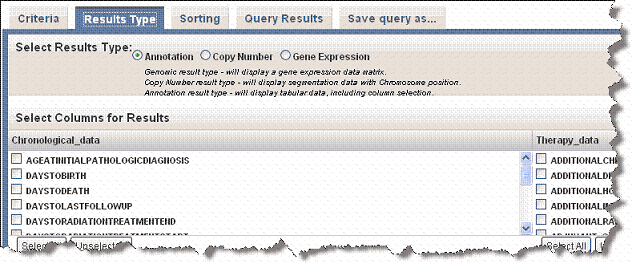
- Annotation - Select the annotation elements that you want to display in the search results. All elements listed are column headers in the data uploaded to the study. You can make multiple selections on this list.
Info title Note For subject annotations, the Patient or Subject Identifier displays by default in the search results.
Results display as tabular data. - Copy Number - This option appears only if the open study includes copy number data. If you select this option, the annotation elements initially displayed on this tab disappear, and you are asked to run the query again. Based on the criteria you defined, the Query Results tab shows a data matrix containing samples against the genomic region you specified. For more information, see #Copy Number Searches and Copy Number Data.
- Gene Expression - Select the Reporter Type and Results Orientation.
- Gene Name – Finds and summarizes at the gene level all reporters that match criteria for the gene you defined on the Criteria tab
- Reporter ID – Finds all reporters that map to the gene(s) you identified on the Criteria tab
- Genes in rows/Subjects in columns or Genes in columns/Subjects in rows – Determines query results matrix format
Results display in a gene expression data matrix. For more information, see Gene Expression Data.
- Imaging - If imaging annotations have been added to the study, annotation elements also display on the lower right section of this page when you select Annotation. All elements listed are column headers in the image annotation data uploaded to the study. You can make multiple selections on this list.
Info title Note If you select even one Image Annotation on the Results Type tab, the Image Series IDs display by default in the search results. If you select no Image Annotations on the Results Type tab, however, even if you have selected image series criteria on the Criteria tab, no image series IDs display in the search results. The fact that images can be located, however, in NBIA is indicated by two image-related buttons at the bottom of the Query Results page. You can open the images in NBIA, but they will be at StudyInstance UID level. See #Relationship of Patient to Study to Series to Images.
- Use the Select All or Unselect All buttons to aid you in making your selections.
Results display as tabular data. For more information, see Subject Annotation and Imaging Data.
...