Page History
...
- Select or enter data for the Fold change fields shown in the following figure and described below.

- Gene Symbol - See #Gene Names Search.
- Control Sample Set – If multiple platforms are part of the study, your platform selection in the Fold Change query criteria determines the control samples that are available.
Select from the drop down list the name of the uploaded control sample set to serve as the fold change reference. - Regulation Type – Select the term that describes the gene expression in comparison with the control samples: Up is increased expression; Down is decreased expression; Up or Down is increased or decreased; Unchanged means no change in expression.
- Up-regulation Folds – Enter a numerical value representing fold change. The number you enter here is dependent upon the Regulation Type you selected.
- Up = Up Regulation Folds – Samples with a fold change greater than this value, when compared to the control samples, will be returned.
- Down = Down Regulation Folds – Samples with a fold change less than this value, when compared to the control samples, will be returned.
- Up or Down = Down Regulations Folds, Up Regulation Folds – Samples with a fold change either up or down, when compared to the control samples, will be returned.
- Unchanged = Samples with a fold change between the two specified values will be returned.
For example, if you enter 2.0 in this field, after selecting Up in the previous field, the search will locate genes whose expression is 2 times (2-fold up regulation) the base value.
- Up = Up Regulation Folds – Samples with a fold change greater than this value, when compared to the control samples, will be returned.
- To search for Gene Symbols, see Choosing Genes.
- Continue with step 6 in Searching a caIntegrator Study.
...
- Select or enter data for the copy number query fields shown in the following figure and described below.
 .
.- Segment Mean <= – Enter the value equal to or less than the higher limit of change.
- Segment Mean >= – Enter the value equal to or greater than the lower limit of change.
- Genome Interval > Gene Name – See #Gene Name Search
- Genome Interval > Chromosome Number – In the text box that opens, enter the chromosome number you want the query to search against.
- Genome Interval > Chromosome Coordinates – In the From and To text boxes that open, enter the range on the chromosome you want to search. This defines the chromosomal boundaries of the region with the suspected copy number variations.
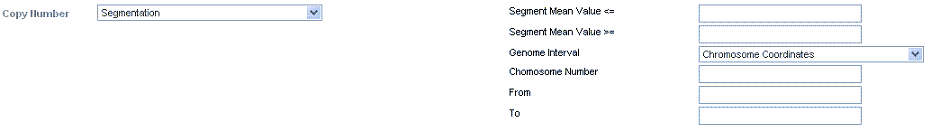
The Bioconductor DNAcopy algorithm (see Copy Number Data) identifies the location of the amplification or deletion and then reports it as the base pair at the start and stop of the segment. Each segment is then catalogued with chromosome number, start coordinate, stop coordinate, genes in the segment, and the segment mean value.
- Segment Mean <= – Enter the value equal to or less than the higher limit of change.
- To search for Gene Symbols, see Choosing Genes.
- Continue with step 6 in Searching a caIntegrator Study.
...
- Select or enter data for the copy number query fields shown in the following figure and described below.
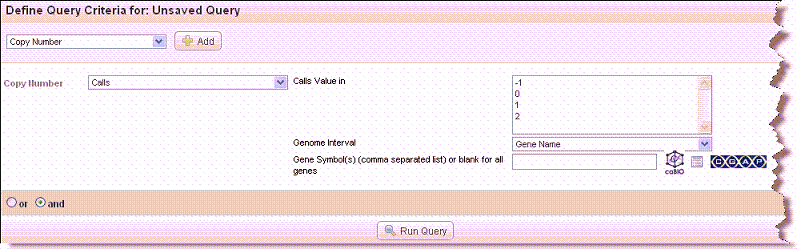
- Copy Number values: Select one or more of the Calls values. Values are -1 (loss), 0 (normal) or 1, (gain). If four levels were used for calling, a value of 2 represents an amplification.
- Genome Interval > Gene Name – See #Gene Names Search.
- Genome Interval > Chromosome Number – In the text box that opens, enter the chromosome number you want the query to search against.
- Genome Interval > Chromosome Coordinates – In the From and To text boxes that open, enter the range on the chromosome you want to search. This defines the chromosomal boundaries of the region with the suspected copy number variations.
For more information about CGHCalls, see CGHcalls.
- To search for Gene Symbols, see Choosing Genes.
- Continue with step 6 in Searching a caIntegrator Study.
| Include Page | ||||
|---|---|---|---|---|
|
Configuring Query Results Display
...