Page History
...
You can select on the Results Type tab a preferred orientation for displaying the results: genes in rows and subjects in columns, or genes in columns and subjects in rows.
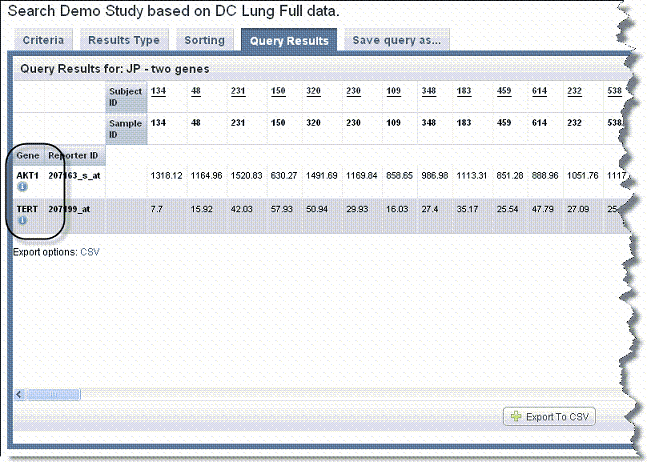
For Gene criteria, the cells display the median gene expression value for each gene. caIntegrator finds and summarizes at the gene level all reporters that match criteria for the gene you defined on the Criteria tab. When displaying results at the gene level, the mean is displayed if there are two probes, the median if there are an odd number of probes greater than two and the mean of the two median probes if there is an even number of probes greater than two. Next to each gene symbol, caIntegrator displays an icon ( ) which you can click to open the Cancer Genome Anatomy Project (CGAP) showing data for the gene. Icons Gene symbols and icons are identified in the following figure.
...
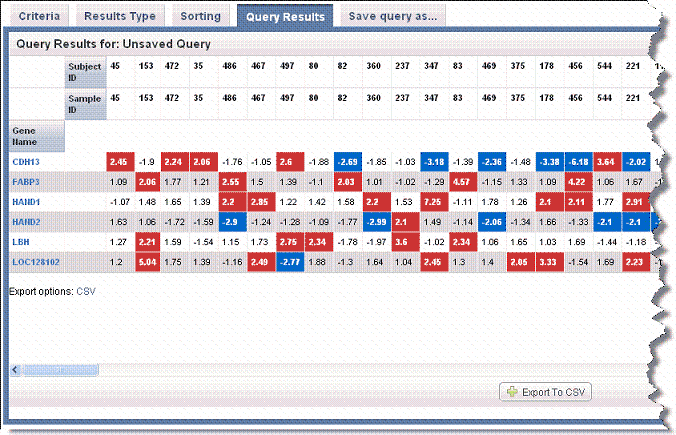
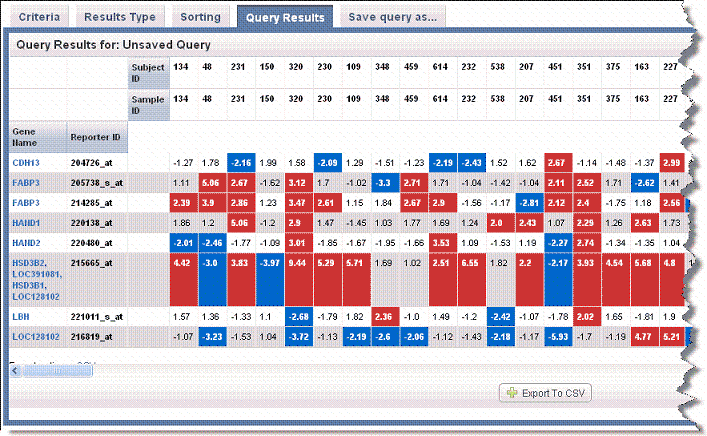
For fold-change criteria, the cells display the normalized signal-based value for a given reporter for a given sample. In the results matrix, caIntegrator highlights matrix values for fold change results that meet fold change criteria. Red represents upregulated values and blue indicates downregulated values. The following two figures display gene name search results with gene reporter type display in the first and reporter ID reporter type display in the second. Note the left hand column in each example.
Gene reporter type display
Reporter ID reporter type display
...