Page History
...
You can add details for one or more subjects by configuring them on the Results Type tab. Annotations listed there are the column headers in the CSV file(s) that were uploaded to the study. For information about using the Results Type tab, see Results Type Tab.
Gene Expression Data Results
If after defining gene expression criteria on the Criteria tab, you select the Gene Expression result type on the Results Type tab, genomic data search results display in a gene expression data matrix. Because the data was downloaded from caArray, the data permissions granted there still apply. In other words, if you have been given access to the data in caArray, you can see it in caIntegrator.
...
You can save genes identified in the search results as a gene list. For more information, see #Creating a Gene or Subject List.
Copy Number Data Results
After defining copy number criteria on the Criteria tab and running a copy number query, you should select the Copy Number result type on the Results Type Tab, and rerun the query. Copy number data search results display in a data matrix containing samples vs. genomic regions.
- Gene symbols display parallel to chromosome regions on the matrix.
- Sample ID column headings display the Subject ID/Sample ID (for example, E09262/E09262) because each calculation is based on a comparison of a tumor and matched blood sample from the same subject.
- The values in the Sample ID columns are mean segment values as calculated by the DNAcopy algorithm, shown in the following figure. These are expressed as log2 (test/reference, as in tumor/normal). For more information about the algorithm, see Bioconductor.
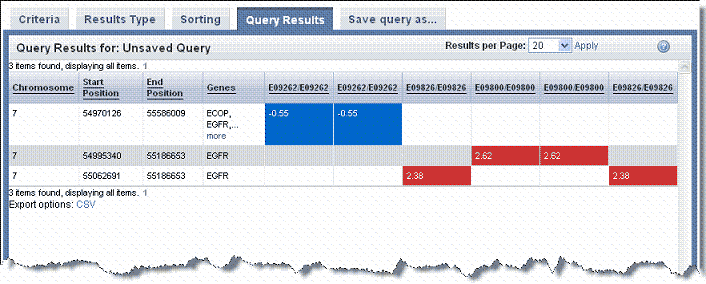
DNAcopy ouput values can be negative. If the test and the reference genomic samples both have two copies of a chromosomal region, the ratio of test/reference is '1', and the log2(1) = 0. That is, if there is no change in the chromosomal structure, then the value is 0. If there are more copies in the test sample (amplification of the chromosomal segment), the ratio of test to reference is greater than 1, and the log2(test/reference) is greater than 0. For example, if the test sample has 6, the ratio or test/reference is 6/2 = 3; log2(3) = 1.58. In a deletion, the test is less than the reference, for example 1. The DNAcopy output value would be log2(1/2) = log2(0.5) = -1.0. Values below -0.6 are often considered a deletion.
Creating a Gene or Subject List
From any page in caIntegrator that shows such a group, you can save a list of genes or subjects so you can use it for searches or analyses. This functionality can also be used where a gene or subject list was created outside of caIntegrator, for example, a list of subjects with validated mutation such as from TCGA projects, or a list of subjects with high EGFR expression or any lists of subjects with genomic or clinical characteristics determined with other tools.
...
| Include Page | ||||
|---|---|---|---|---|
|
Viewing Data with the Integrative Genomics Viewer
Once you have run a query for gene expression, or for copy number, you can view results in the Integrative Genomics Viewer (IGV).
...
- With the appropriate study open, click Integrative Genomics Viewer on the left sidebar. This opens the View IGV Selector page, shown in the following figure.

- In the drop-down list, select the Gene Expression Platform for the data you want to view.
- Select the Copy Number Platform ID.
- The Annotations - Default panel displays existing annotation fields for the gene expression data in the open study. Select those fields you want to view when you open the IGV. Use the buttons for convenience if you want to Select All or Unselect All, when all are checked.
- Click View to see the data in the Integrative Genomic Viewer. caIntegrator creates IGV files of the data.
- After the files are created, click the Launch Integrative Viewer hypertext link that appears.
- Continue with Step 3 in #Method 1 IGV.
Viewing Data with Heat Map Viewer
Once you have run a query for gene expression, or for copy number, you can view results in the Heat Map Viewer (HMV).
...
- With the appropriate study open, click Heat Map Viewer on the left sidebar. This opens the View Heat Map Viewer Selector page, shown in the following figure.

- Select the appropriate Copy Number Platform in the drop down list.
- The Annotations - Default panel displays existing annotation fields for the gene expression data in the open study. Select one or more annotations in the annotation list. For convenience, you can use the Select All or Unselect All buttons.
- Click View to view the data you select in Heat Map Viewer. caIntegrator creates Heat Map Viewer files of the data.
- After the files are created, click the Launch Heat Map Viewer hypertext link that appears.
- Continue with Step 3 in #Method 1 HMV.
Info title Note For interpretation of the results and using HMV features, see the help files opened from HMV.
Java for IGV and Heat Map Viewer
To use the IGV and the NCI Heat Map viewer, described in #Viewing Data with the Integrative Genomics Viewer and #Viewing Data with Heat Map Viewer, you must install a version of Java containing Java Web Start. You must install recent versions of the Java Development Kit (JDK 1.5.0 aka JDK 5.0 or newer) or Java Runtime Environment (JRE 1.5.0 aka JRE 5.0 or newer). The easiest option is to install JRE 5.0. For more information, see http://www.java.com/en/download/faq/java_webstart.xml.
...
| Info | ||
|---|---|---|
| ||
The first time you launch the IGV or HMV with Java properly installed, regardless of browser type, a warning may appear: the "the digital signature cannot be verified". Click Run to proceed with opening the viewer. |
Imaging Data Results
In reviewing imaging search results, it is important to understand the hierarchy of submissions in NBIA. For more information, see #Relationship of Subject to Study to Series to Images.
...
You can set display parameters for the results on the Columns and Sorting tabs. For more information, see #Results Type Tab.
See also #caIntegrator and NBIA, [#Retrieving DICOM Images and #Example of Retrieving Images.
caIntegrator and NBIA
Images can be accessed in NBIA if you see buttons on the Search Results page. See the Imaging Note in #Results Type Tab. You can click links on the Search Results tab to view or download image data.
...
- Forward to NBIA – This button is linked to results you have selected by row. Click the button to open NBIA, where the image series you select are loaded in the NBIA image basket. In the event that the caIntegrator study was NOT configured with image annotation for an image series, caIntegrator sends NBIA a list of Study Instance UIDs, for which NBIA will add all corresponding image series to the basket. In the event that the caIntegrator study was configured with annotations for an image series, the system sends NBIA a list of Image Series IDs, for which NBIA adds all corresponding image series to the basket.
34. Retrieving DICOM Images
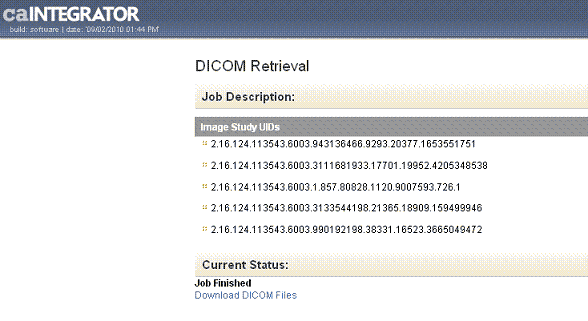
On the caIntegrator imaging data Search Results page, you can click the Retrieve DICOM Images button which is linked to results you have selected by row. caIntegrator retrieves the corresponding image(s) from NBIA through the grid. NBIA organizes the download file by patient ID, StudyInstance UID, and ImageSeries UID, and compresses it into a zip file. When caIntegrator notifies you that the file is retrieved, the DICOM Retrieval page indicates whether the retrieved files are Study Instance UIDs or Image Series UIDs, shown in the following figure.
...
To best understand this, it is important to review the hierarchy of submissions in NBIA. For more information, see #Relationship of Subject to Study to Series to Images.
Example of Retrieving Images
If you are searching a study that has image data and image annotation(s) for at least one image series, you would follow these steps:
...
| Include Page | ||||
|---|---|---|---|---|
|
Exporting Data
You can choose to download tabular search results as a CSV file. Click the Export .csv link at the bottom of the page. You may need to scroll the page to see it. The file contains the annotations, columns and data sort configurations you specified in the search query.
...