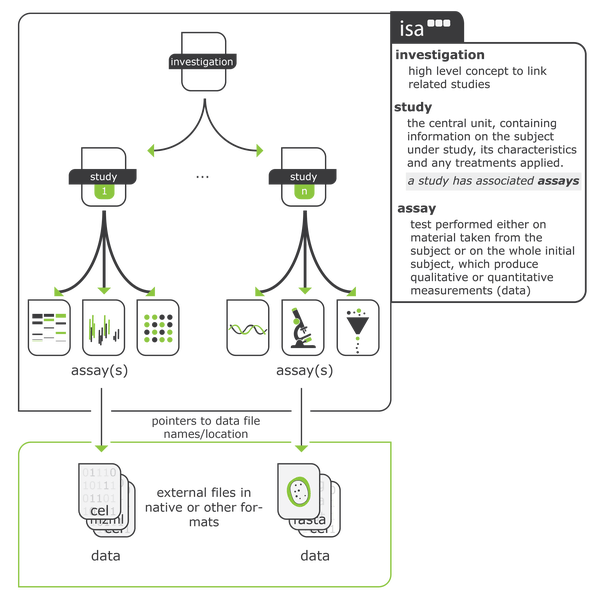
The CSSI DCC Portal is a public repository of experiment-related information describing cancer research investigations. You can use the portal to browse, search, and access data generated through CSSI funded projects and other user uploaded data sets. This data is in ISA-Tab format, which organizes investigation, study, and assay data according to the rules in the ISA-Tab specification  .
.
Each data set contains three files--investigation, study, and assay--that conform to the ISA-Tab structure and naming conventions. Within this structure are fields that are standard for each type of file, though null values are allowed; that is, not every data set includes values for each field. The portal allows you to filter these fields in an interactive way so that you can visualize the data in a pie chart or list.
You can search investigations, studies, and assays using any keyword. You can download selected files, the entire data archive, or only the metadata associated with a study. You can also upload your own investigation data to the portal and make it open access. (For more information, refer to Uploading Investigation Data and Making it Open Access.)
The following sections provide detailed instructions on how to browse, search, and download data.
Accessing Investigation Data
To access investigation data in the CSSI DCC portal, the prerequisites are as follows:
- URL or web address. The URL might be from the Browse page, the Search page, an email message, or a browser bookmark. The URL for a specific version of an investigation remains the same over time. (For information on the Browse or Search pages, refer to Browsing Investigations or Searching Investigation Data.)
- Permission to view the data. When a user uploads an investigation to the CSSI DCC portal, that user specifies who can access the investigation data. For details, refer to Controlling Access to Investigation Data.
If you are unable to find the data for an investigation, consider the following points:
- A typo might have been introduced in your copy of the URL.
- The investigation embargo date might still be in the future.
- The user who uploaded the data might not have made it open access yet or might not have given you permission to view it.
- The investigation might have been deleted.
Browsing Investigations
To browse investigations
From the CSSI Data Portal home page, click the Browse button or select Investigations > Browse.

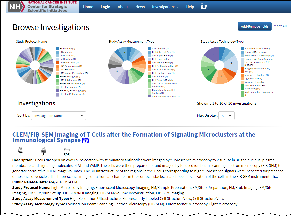
The Browse Investigations page appears with two interactive components:A list of all investigations currently included in this release of the CSSI DCC Portal
Pie charts at the top showing fields from the investigations
A subset of the page appears in the following screenshot. (Click the image to expand it.)
For more details, refer to the following pages:
Understanding the Pie Charts
- Study Protocol Name
- Study Assay Technology Type
- Study Assay Measurement Type
The values for those fields, as well as a count for each value, appear in the pie charts. The count represents the number of times that field value occurs in all of the investigations currently in the portal. (Click the following image to expand it.)

For example, the default pie charts represented in the above screenshot show the following information:
- The Study Protocol Name pie chart shows that four investigations used a blood draw protocol.
- The Study Assay Technology Type pie chart shows that two investigations used light microscopy.
The sum of numbers in each pie chart can exceed the total number of investigations in the system, because each investigation can have more than one value in each pie chart. You can determine the values for each investigation by clicking on each pie slice and reviewing the details in the list below the charts.
Click one or more field values in the pie charts ("slices") to filter the data by that/those field value(s). The more field values you select, in one or more pie charts, the more narrowly you filter the investigation data and the fewer investigations match your selections. The investigation list refreshes each time you filter the data in this way. You can also customize which fields appear in the pie charts and how many pie charts appear by adding and removing fields. (For instructions, refer to Adding and Removing Fields.)
In the following screenshot, a user has selected at least one field value in each pie chart. The selected values are:
- Scanning in the Study Protocol Name chart
- CNV analysis in the Study Assay Measurement Type chart
- Next Generation Sequencing in the Study Assay Technology Type chart
Only one investigation matches all of these selections and appears in the list below the charts. To reduce the amount of filtering, you can take one of the following actions:
- To reset an individual pie chart, click reset on that chart.
- To reset all pie charts to their defaults, you can take one the following actions:
- Click Reset All.
- Select Investigations > Browse.
(Click the following image to expand it.)

Understanding the Investigations List
- In the Study Protocol Name pie chart, a user has selected one field value nucleic acid extraction. The number 3 on the selected pie slice means that three investigations are associated with the Study Protocol Name field value of nucleic acid extraction.
- In the Study Assay Measurement Type pie chart, all investigations use the same value of nucleotide sequencing.
- In the Study Assay Technology Type pie chart, two investigations have a value of transcription profiling and one investigation has a value of genome sequencing.
(Click the following image to expand it.)

The fields in the Investigations list match the pie chart selections. The list includes only those three investigations that have a Study Protocol Name field value of nucleic acid extraction. Details for each investigation in the list includes the same fields represented by the pie charts: Study Protocol Name, Study Assay Technology Type, and Study Assay Measurement Type, plus the study name, description, and public release date. The list also shows additional data about each investigation, such as the other keywords used in the Study Protocol Name field. You can return to the default (full) list at anytime by selecting Investigations > Browse.
You can control various aspects of the list:
- To control how many investigations appear in the list, select a value from the Max Display box.
- To change how the list is sorted, select a value from the Sort By box.
If you add or remove fields from the pie charts, as described in Adding and Removing Fields, the Investigations list fields immediately reflect the same changes.
Adding and Removing Fields
You can customize which pie charts appear at the top of the page. Since the pie charts control how you filter the investigation data, you may prefer something other than, or in addition to, the three default fields of Study Protocol Name, Study Assay Technology Type, and Study Assay Measurement Type.
To add or remove fields
On the Browse Investigations page, click Add/Remove fields. The Metadata Selection panel appears to the left of the pie charts. (Click the following image to expand it.)

You can either search or browse for a field of interest in the Metadata Selection panel:
Expand fields by clicking the triangle icon next to each item.

In the Search field, start typing any part of a field name. The system filters the list of fields by that search term. (To clear a search term, click clear. The system unfilters the list of fields.)

Note the default selection of some fields:
Studies > STUDY PROTOCOLS > Study Protocol Name
Study Assays > Assay > Study Assay Technology Type
Study Assays > Assay > Study Assay Measurement Type
These field values are the ones that appear in the three default pie charts on the Browse Investigations page. If you clear these check boxes, those pie charts disappear from the page. When you reset all of the pie charts or select Investigations > Browse, however, they reappear.

Click any check box to select the corresponding field. For example, select Study Protocol Type and click Submit. The pie charts update to include one for Study Protocol Type.

Correspondingly, the Investigations list updates to show Study Protocol Type in the fields available for the investigation.

You could also opt to clear all of the check boxes except for Study Protocol Type. In this case, that is the only pie chart that would appear.

When you clear a field, it also disappears from the Investigations list.
- When you have selected or cleared as many fields as you want from the pie charts, click Hide select menu. The Select menu moves back to its original position.
Exploring Investigation Details
To explore investigation details
Browse investigations or search investigations until you find an investigation, a study, or an assay in which you are interested. For instructions, refer to Browsing Investigations or Searching Investigation Data. The search results appear.

Click the link corresponding with the investigation, study, or assay you are interested in exploring. The respective investigation details, study details, or assay details page appears. For information, refer to the following pages:
- You can do the following from the details pages:
- Explore the data at every level of the investigation. For instructions, refer to Visualizing and Filtering Data.
- Filter the data so that you can download selected data. For instructions, refer to Downloading Investigation Data.
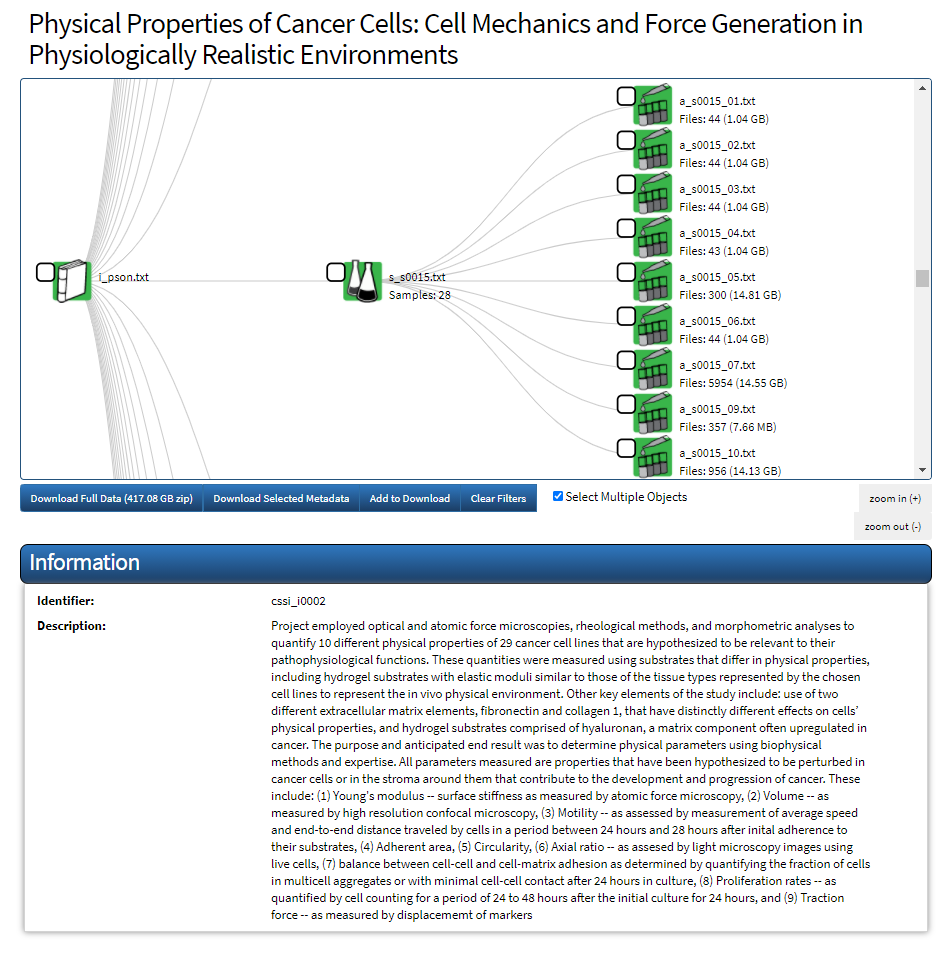
Investigation Details Page
- The investigation name is at the top.
- A visualization includes the following icons and information:
- Icon and filename for the investigation node.
- Icon, filename, and number of samples for each study node.
- Icon, filename, number of files, number of links (external file links), and total file size for each assay node.
All of the icons in this visualization are clickable links.
- Below the visualization are buttons to download all or part of the investigation.
- Below the download buttons are the investigation identifier and its description.
The currently selected icon has a green box behind its icon in the visualization. When the investigation is selected, its studies and assays are also selected. In the following screenshot, the investigation is selected.

If an investigation has many studies or assays, the visualization is horizontal and can be zoomed in and out. For example, the following investigation has 29 study files with 10 assay files each, totaling 290 nodes. The zoom out and zoom in buttons are below the visualization, as indicated below.

Study Details Page
- The investigation name is at the top.
- A visualization includes the following icons and information:
- Icon and filename for the investigation node.
- Icon, filename, and number of samples for each study node.
- Icon, filename, number of files, number of links (external file links), and total file size for each assay node.
All of the icons in this visualization are clickable links.
- Below the visualization are buttons to download all or part of the investigation.
- Below the download buttons are the study title, identifier, and description.
The currently selected icon has a green box behind its icon in the visualization. When a study is selected, its assays are also selected. In the following screenshot, the study is selected.

Assay Details Page
- The investigation name is at the top.
- A visualization includes the following icons and information:
- Icon and filename for the investigation node.
- Icon, filename, and number of samples for each study node.
- Icon, filename, number of files, number of links (external files), and total file size for each assay node.
All of the icons in this visualization are clickable links.
- Below the visualization are buttons to download all or part of the investigation.
- Below the download buttons are the assay filename, measurement type, and technology platform.
- In the Visualize and Select section, the relationship of the study to its processes, and its processes to its files, are depicted in clickable icons. In this section, a filter icon indicates a node that has values to filter. Click any icon to further filter the investigation data and download only a selected portion of it.
The currently selected icon has a green box behind its icon in the visualization. In the following screenshot, the assay is selected.

In the following screenshot, a filter icon indicates the Sample node has values to filter.

Visualizing and Filtering Data
The following diagram depicts the hierarchy, without the samples and protocols.
The following page family describes how to visualize and filter data of each type.
Visualizing and Filtering Investigations

In the CSSI DCC Portal, you can filter data at the study and assay level. At the investigation level, you cannot currently filter data. At this point, you can only download the investigation's full data, or start exploring its studies and assays.
Selecting Multiple Objects
For example, the following investigation has many studies and assays, so it displays horizontally with a slider on the side to move up and down. It also has zoom out and zoom in buttons to see more or fewer objects.
Select the boxes next to the objects you want to visualize and filter. If you download these objects, all of these selected objects will be included in the download.
Visualizing and Filtering Study Data
You can also select multiple objects to visualize and filter within a single investigation. For instructions, refer to Selecting Multiple Objects.
To visualize and select study data
- Open a Study Details page.

In the Visualize and Select area, click one of the entities that has a filter icon.
Study Hierarchy
The hierarchy of entities for studies according to the ISA-Tab standard is as follows, from less granular to more granular:
Source > Protocol > Sample
For example, click Source. Metadata for that source appears.
Follow this same procedure if you want to filter on Protocol or Sample instead of Source.

- From the Source Name list, click the arrow to open the list of values. Each value is a Source Name from the study file. The screenshots in this page reflect a study file named s_001.txt.

- Click one or more values in the list to select them. Each value appears immediately below the Source Name box. To clear a selection, click the value again.

- Click Filter Results. The Source Count reduces from the original values in the unfiltered study file to the values selected in this procedure. The screenshots in this page reflect four values in the unfiltered study and then two values in the filtered study.

- At this point, you can choose one of the following options:
- Continue to explore this data set.
- Download the metadata of the three values you selected. For instructions, refer to Downloading Selected Metadata.
- Download the selected data of the three values you selected (which includes the metadata). For instructions, refer to Downloading Selected Data to Your Computer.
- Click Clear Filters to filter a different entity.
Visualizing and Filtering Assay Data
You can also select multiple objects to visualize and filter within a single investigation. For instructions, refer to Selecting Multiple Objects.
To visualize and select assay data
- Open an Assay Details page.


In the Visualize and Select area, click one of the entities that has a filter icon. Note that the width of some visualizations require you to scroll by clicking the arrows at the bottom of the page.
Assay Hierarchy
The hierarchy of entities for assays according to the ISA-Tab standard is as follows, from less granular to more granular:
Sample > Protocol > Data File
For example, click the sample. Metadata for the sample appears.
Follow this same procedure if you want to filter on protocol instead of sample.

- From the Sample Name list, click the arrow to open the list of values. Each value is a Sample Name from the assay file. The screenshots in this page reflect an assay file named a_001.txt.

Click one or more values in the list to select them. To select multiple values, click one, wait for it to appear on the Metadata for Sample page, and then click the arrow again to select another value. To clear a selection, click that value again.

Some entities do not have associated metadata fields on which you can filter the study or assay. In that case, when you click the icon for that entity, you see a message letting you know that no metadata fields are available.

- Click Filter Results. The Sample Count reduces from the original values in the unfiltered assay file, to the values selected in this procedure. The screenshots in this page reflect three values in the unfiltered assay and then two values in the filtered assay.

- At this point, you can choose one of the following options:
- Continue to explore this data set.
- Download the metadata of the three values you selected. For instructions, refer to Downloading Selected Metadata.
- Download the selected data of the three values you selected (which includes the metadata). For instructions, refer to Downloading Selected Data to Your Computer.
- Click Clear Filters to filter a different entity.
Searching Investigation Data
- Keyword or phrase in all fields or specific fields
- Related terms from ontologies
The following page family describes how to use these various searches.
Performing a Basic Search
To perform a basic search
From the CSSI Data Portal home page, click the Search button or select Investigations > Search.

The Search Investigations page appears.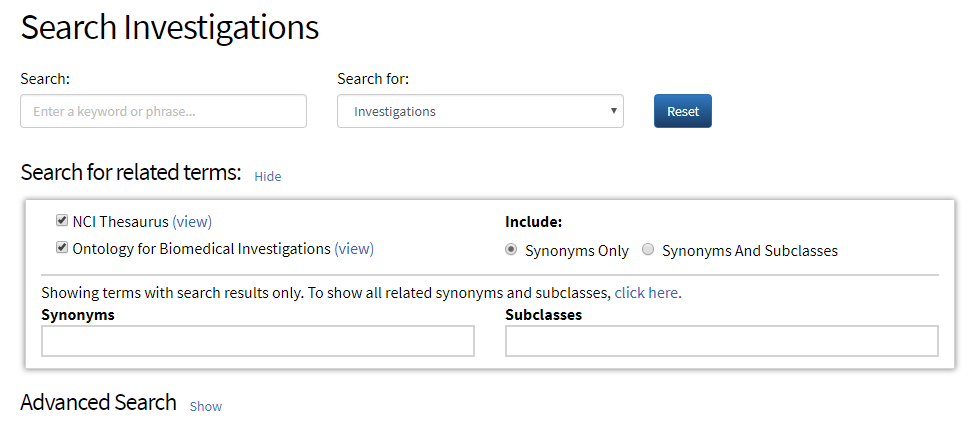
- In the Search box, enter a keyword or phrase. Search is not case-sensitive. Search results appear immediately, using the default context of Investigations.
To change the context, from the Search for list, select Studies or Assays. The system restricts your search to the context you select.
To clear search items, click Reset.
Searching by Keyword or Phrase
You can search all investigations, studies, and assays in the CSSI DCC Portal by keyword or phrase. Search terms fewer than 4 characters are treated as full words. Search terms of 4 or more characters are treated as both full words and partial words, if applicable.
To search investigation data by keyword or phrase
Perform a basic search, as described in Performing a Basic Search. Search results appear below the search criteria area.
In the following example of search results, the keyword for the search is cell and the context is Investigations. All investigations that include the word cell anywhere in the investigation metadata appear in these search results.

The results include information specific to the context, as follows:Context Displayed Information Investigations The investigation name, number of studies, number of assays, number of files, description, and public release date. Studies The study name, name of the investigation the study is associated with, number of assays, number of files, and description. Assays The assay filename, name of the study that the assay is associated with, name of the investigation the assay is associated with, number of files (such as image files), and description. To view where in the metadata your search term occurs, click view next to the search term. For details, refer to Viewing Detailed Search Results.
Searching ISA Tab Fields
You can search all investigations, studies, and assays in the CSSI DCC Portal by field-specific keyword or phrase. You can select one or more ISA tab fields, and then apply a search term to each specific field.
A field-specific search typically reduces the number of search results. For example, consider a system that has two investigations with 'tumor' mentioned only in the Investigation Title field, and two investigations with 'tumor' mentioned only in the Investigation Description field. In this example, if you search for 'tumor' as a basic search, the system lists four investigations. However, if you search for 'tumor' within the Investigation Title only, the system lists only two investigations.
To search ISA Tab fields
Perform a basic search, as described in Performing a Basic Search. Search results appear below the search criteria area.
Next to Advanced Search, click Show. The Advanced Search panel appears.

From the list, select the field in which you want to search. The fields available depend on the selected context (Investigations, Studies, or Assays). For example, if you have selected the Investigation context, you can filter search results by Investigation Public Release Date.


For each field that you have selected, enter a keyword or phrase. Search is not case-sensitive.

For example, if you have selected the Investigation context and the Investigation Public Release Date field, you could enter the following date range for that field:
04/01/2018 through 04/18/2018- If you want to remove an individual field, click the X next to it. (If you want to clear all fields, click Clear Advanced Search.)
- Click Run Search (or press Enter). Search results with an exact match appear below the search criteria area.
Searching by Related Terms
You can search all investigations, studies, and assays in the CSSI DCC Portal by terms found in related ontologies, for example, the Ontology for Biomedical Investigations and NCI Thesaurus (NCIt). A search looks for synonyms and subclasses of the keyword you entered in the ontology(ies) you selected and matches them to investigations, studies, and assays in the CSSI DCC Portal. The matching ontological terms can exist in file columns, field definitions, and placeholders of the investigations, studies, or assays.
To search investigation data by related terms
Perform a basic search, as described in Performing a Basic Search. Search results appear below the search criteria area.
- Under Search for related terms, select Ontology for Biomedical Investigations, NCI Thesaurus, or both. By default, both are selected but if you change the selection, the search results refresh.
- Under Include, select either Synonyms Only or Synonyms And Subclasses.
- Synonyms include terms in an ontology that are closely related to the keyword or phrase you entered.
- Subclasses are lower categories associated with the ontology term.
If any ontological synonyms or subclasses of the keyword you selected exist in the CSSI DCC Portal, those terms appear in the Synonyms or Subclasses box, respectively.
In the following example, the keyword is neoplasm and its synonym found in one or both of the selected ontologies is tumor. The subclasses of tumor that appear in the search results appear in the Subclasses box. You can click any of those terms and refresh the search results to show only those investigations, studies, or assays that contain those terms. In the following example, only adenocarcinoma is selected. Note that the selected term has a solid black outline while terms that are not selected have a dotted line.
To expand your ontological search to include all synonyms and subclasses, even if they do not appear in the search results, click the click here link. The page refreshes and shows all synonyms and subclasses, even if they're not in the search results. You can return to the view of synonyms and subclasses only in the search results by clicking click here again. - Click any investigation name, study name, or assay filename to explore the data further.
Viewing Detailed Search Results

A detailed search results window appears. The matching term, cell, is highlighted in the metadata of each file in the ISA-Tab archive.

To close the window, click Ok at the bottom or the x in the upper-right corner of the window.
Saving Search Parameters
To save search parameters
- Log in to the CSSI DCC portal. For instructions, refer to Logging In to the CSSI DCC Portal. Your email address appears in the upper-right corner of the screen.
- Perform a search, as described in one of the following sections:
- Click Save Search. The Saved Search dialog box appears with details about the search you are saving.

- Specify a name for this search. Click Save. A message appears indicating that the system has saved your search.

- Click Ok.
For instructions on managing your saved searches, refer to Managing Saved Search Parameters.
Managing Saved Search Parameters
To manage your saved search parameters
- Log in to the CSSI DCC portal. For instructions, refer to Logging In to the CSSI DCC Portal. Your email address appears in the upper-right corner of the screen.
Click your email address and then click Saved Searches. A page by that name appears, listing the searches you have saved. Initially, the most recent entry is the default. (The system loads the default saved search on login.)

- You can take the following actions:
- To sort the list, click the Name, Date, Search Term, or Search Context column heading.
- To rename a saved search, click the current name and type the new one. Click elsewhere. A message appears confirming the name change. Click Ok.
- To specify a different saved search as default, click the radio button under Default in the row for that search. The system immediately saves your change.
- If a saved search has more than three key-value pairs for advanced search criteria and you want to see all of them, click Show more.
- To delete a saved search, click the trash can icon in the row for that search. Your browser prompts you to confirm the deletion.
- To run a saved search and view the results, click the triangle icon in the row for that search.
Downloading Investigation Data
- If you download just the selected metadata, file sizes are minimal. Metadata describes the structure of the data collected in an investigation and translates to the file columns, field definitions, and placeholders that can be viewed in a spreadsheet. It is in Investigation-Study-Assay tab-delimited format (ISA-Tab), which is based on the ISA-Tab specification:
http://isatab.sourceforge.net/docs/ISA-TAB_release-candidate-1_v1.0_24nov08.pdf
- If you download data, the data files often include image files and spreadsheets, and file sizes can be large.
- For any downloads exceeding 30 GB, we highly recommend using Globus.
- The option to download full data allows you to download full data for the investigation (even if you are currently viewing a Study Details page or Assay Details page). Also, this option is limited to just the one investigation you are viewing.
- The option to download selected data allows you to download data files and associated metadata from multiple investigations, as well as selections at any level of the data structure (investigation, study, assay, source, protocol, sample, or data file). If you select multiple objects to visualize and filter, a download includes all of those objects, by default. For information, refer to Selecting Multiple Objects.
- If another DCC user has given you a link, such as from a "CSSI DCC Portal File Download Ready" message, your ability to download that data depends on various factors. For information, refer to Accessing Investigation Data.
Each download option has a button on the Investigation Details page.

- Download Full Data downloads only data files for the entire investigation. Since this can be a large file size, the file size appears on the button.
- Download Selected Metadata downloads only the metadata of a selection you make.
- Add to Download downloads the data files of one or more selections you make, with or without filters applied. (Filtered or partial investigations include both data and metadata; full investigations contain only data.)
The following page family describes the various methods of downloading data.
Downloading Full Data
Downloading Selected Metadata
Downloading Selected Data
Downloading Large Files with Globus
Managing Your Downloads
- Each time you download data while logged in, the system archives that download.
- You can view a list of your previous downloads.
- Partial or filtered downloads expire in seven days. Full downloads never expire.
- A full download is an unfiltered download of an entire investigation.
- A filtered download is one created by selecting metadata in the Visualize and Select section of the investigation, study, or assay details page. For instructions, refer to Visualizing and Filtering Data.
- A partial download is a filtered download, or a download at the study or assay level.
- If an archived download has not expired, you can download it again. If a download has expired, you can download it only one more time.
- If something interrupts your download, you can resume the download.
- The system constructs download zip filenames with the following components:
- Investigation ID (for example, 123456789a123456789b1234)
- Investigation title
- "Full" or "Partial"
- "data" if the zip file contains only data
- "metadata" if the zip file contains only metadata
- When constructing the zip filename, the system omits spaces and special characters from the investigation title. If the resulting investigation title is more than 40 characters, the system truncates the title part of the filename as follows:
- The first 19 characters
- Two underscores
- The last 19 characters
- Example download filenames include:
- 123456789a123456789b1234_ExampleInvestigationTitle_Full_data.zip
- 123456789a123456789b1234_ExampleInvestigationTitle_Full_metadata.zip
- 123456789a123456789b1234_ExampleInvestigationTitle_Partial.zip
- 123456789a123456789b1234_ExampleInvestigationTitle_Partial_metadata.zip
- 123456789a123456789b1235_ImagingofTCellsafte__mmunologicalSynapse_Partial_metadata.zip
To manage your downloads
- Log in to the CSSI DCC portal. For instructions, refer to Logging In to the CSSI DCC Portal. Your email address appears in the upper-right corner of the screen.
Click your email address and then click My Downloads. The My Downloads History page appears with a list of your archived downloads. For each download, the list indicates the requested date, a download ID, and a status.
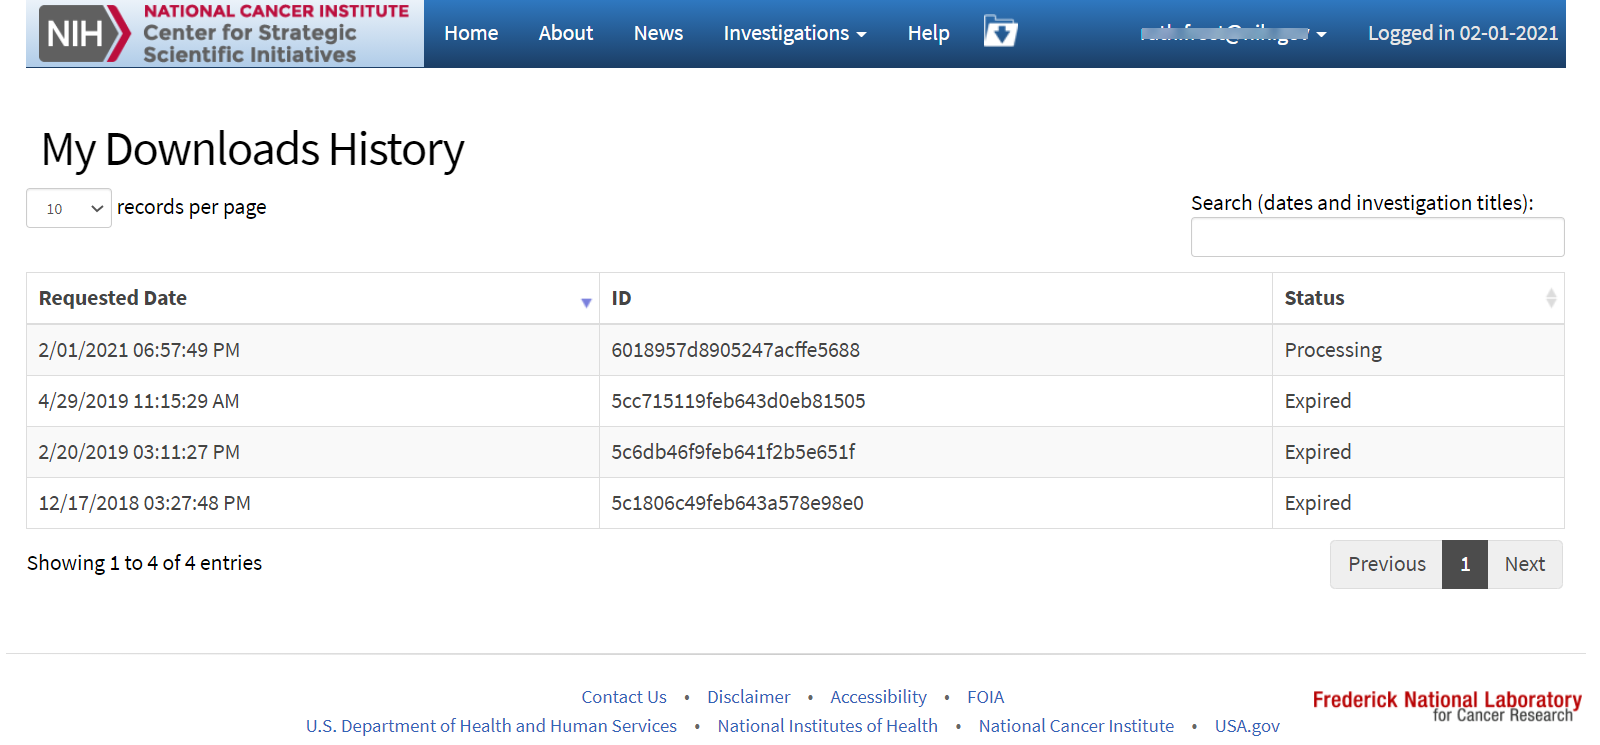
The following table describes each possible status:Status Description Processing The initial status of each download. Ready The status indicating you can repeat the download. Expired The ultimate status of each partial or filtered download. If a download request contains a partial download, the status reflects that download. Therefore, a download request may have a status of Expired, even if the request also contains a full download.
- In the list of downloads, you have the following options:
- To search for a download, in the Search box, start typing a date or investigation title. The system filters the list of downloads. For example, typing "5/21" displays all downloads requested on May 21st.
- To sort the list, click the Requested Date or Status column header.
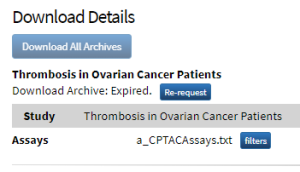
- To repeat a download, click the row for the download you want to repeat. The Download Details section appears, below the list of downloads. The following screenshots demonstrate some examples:
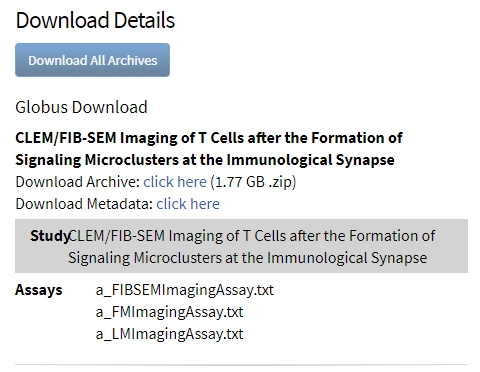
- In the Download Details section, you have the following choices:
- To download just one investigation, click the click here link for that investigation. Follow your browser's instructions to open or save the file.
- To download all content from the selected download record (or to resume an interrupted download), click Download All Archives. (This button is not available for Globus downloads.) The response from the system depends on whether you have installed the DCC Download Manager:
- If you have not yet installed the DCC Download Manager, the system prompts you to install it. For instructions, refer to Installing the DCC Download Manager.
- If you have installed the DCC Download Manager, a dialog box appears, specifying a download directory. For instructions, refer to Using the DCC Download Manager.
- If a partial download has expired, click Re-request. (This option is available only once for each download.) The system processes the request and sends you a message with "CSSI DCC Portal File Download Ready" as the subject line.
Installing the DCC Download Manager
The DCC Download Manager allows you to repeat an archived download, if it has not expired.
To install the DCC Download Manager
- Attempt to download all archives, as described in Managing Your Downloads. If you have not yet installed the DCC Download Manager, a dialog box provides various links.

- Click a link to install the appropriate download manager application for your operating system: Windows or Mac. Follow your browser's instructions to open or save the file. Run the executable. Another dialog box appears.

- Click Quit.
- Repeat the attempt to download all archives, as described in Managing Your Downloads.
- Follow your browser's instructions to associate dccdl links with the DCC Download Manager application. Another dialog box appears, specifying a download directory. For instructions, refer to Using the DCC Download Manager.
Using the DCC Download Manager
To complete a download
- Attempt to download all archives, as described in Managing Your Downloads. A dialog box appears, specifying a download directory. The default download directory is C:\Users\<user name>\Downloads.

- To specify a different download directory, click Set Download Directory. Follow your operating system's instructions to navigate to and select a folder.
Click Start Download. A window appears, indicating the download status for each component.

The following table describes each possible status:Status Description Downloading The initial status of each download. Error The status indicating a problem. If you need support on an error, contact the Center for Strategic Initiatives (CSSI) Data Coordinating Center (https://cssi-dcc.nci.nih.gov/cssiportal/contactus) or click the Contact Us link at the bottom of any DCC page. Interrupted The status indicating you can resume the download. Done The ultimate status of each download.